The system will work in a different way for the people wanting to buy tickets. The system will have a user interface which will automatically open when the system is opened. People will be able to input their own data into the system simply by filling in a series of boxes. This data will be entered into the main database when entered. Mrs Williams will then be able to look through this data and contact people if she needs to.
What Processes will be carried out on the Data?
A number of different processes will have to be done to the data. This does however depend on the kind of data it is. By referring to my main objectives I can see what process will need to be done.
The data that is stored in the main data base (the data inputted to order tickets). All of the data including the above and the data about the costs, will have to have automated formulas and sometimes, macros applied to it. The layout of the spreadsheet needs to be simple and easy to use. Headings should be clear and stand out to help make the system simpler. If I choose to use any graphics, they will need to be re-sized and positioned in a place that doesn’t make the spreadsheet seem complicated and crowded. If I choose to print out any items then they must be printed correctly as excel can sometimes print spreadsheets in a way in which they cannot be understood. I will use colour when showing whether the school is making a profit from the concert. I will use red if they are under profit and black if they are in profit.
One of the most important parts of the system will be the user interface. This is what will make the tickets easy to order. The data entered must be entered directly in to the data base. The user interface must also look simple to use.
How will the data be Presented or Outputted?
The output of my system will be a working on screen electronic system. The data in the system will be filtered and therefore easy to see and understand. At a glance the user will be able to see if they are in profit or not as I will be using colour to make this clear. Colour will also be used to make things easier to understand on the main data base which will contain all the data entered from the user interface. All of the fonts I use will be clear and easy to read. I will make it possible for parts of the system to be printed if a hard copy is required.
How will the user Store and Backup the Data generated by the System?
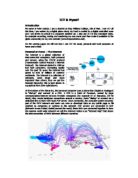
Referring back to my data flow diagram can see that I am going to store the data.
How will the Data within the System be Protected and made Secure?
The data in my system will be protected. Only Mrs Williams or the user of the system in the years to come will be able to access the main database and the page that displays the profits. I will use password protection for this. The public or people who want to by tickets will only be able to access the user interface. The school is already under the data protection act so therefore there will be no problems concerning this.
Data Flow Diagram.
Re-usabilty
The System will be reusable. Mrs Williams will be able to reuse the system in the years to come for every christmas concert. Also, if the school were to hold another similer event, the system could be used to organise this too. If the system is simple to use, it will make it easyer for differeent people to use the system. For example, if Mrs Williams were to leave the school, somebody else would be able to re-use the system. The old data from past concerts can be deleted from the system when it is no longer required. This allows for the system to be re-used as it has been reset.
Design
Design
How will the system look?
I will produce a design of how I imagine my system to look. I need to refer to the original user requirements as I build up the designs. I need to show a series of designs for my system. I will be designing the following:
- Design for seating arrangement spreadsheet
- Design for main database.
- Design for user interface.
- Design for profits and loss spreadsheet.
My designs will show colour and annotation. I will then present these designs to Mrs Williams. I will see what she thinks of them and will make changes accordingly.
Design Specification – the function of each worksheet
I plan to create my system with four sheets in total, three work sheets and a user interface or front end. Below I describe the features of each worksheet. I will use this to help me plan and make my system and how it should be shown in my diagram designs.
Work sheet 1 – Seating arrangement spreadsheet
This worksheet must contain a clear design of the layout of the concert hall showing all the chairs in use. The worksheet must be able to say which seats have been sold and to what type of person (e.g. child or adult). The total amount of money raised from seating sales can be put on this sheet too.
Work sheet 2 – Main database
This worksheet will contain the main database. It will hold all the information gathered by the user interface. I plan that it will hold the following information about the customer: Name, phone number, email address, number of tickets required. I will use formulas in this database to work out totals. I will also try to make the database easily printable, if a hard copy is ever needed.
Work sheet 3 – Profits and loss
This worksheet will be deigned specifically to show the profits and loss of the schools production. This will make it simpler for the user to keep track of spending which has been a problem in the past. I will use formulas to calculate totals. I will use conditional formatting to change the colour of the total amount of money raised so it is quick and easy to tell if they are in profit. The important figures on the page must stand out; I will do this by using borders and bold fonts.
Work sheet 4 – User interface
The user interface will make it quick and simple for the user to input data given to them by customers. The user interface needs to be connected to worksheet 2, in order for all the data that is inputted via the user interface, to go into the main database. I will do this by using macros.
On the next pages are the diagram designs I have created for the worksheets described above.
Detailed design for Seating plan worksheet
The seating plan worksheet is where Mrs Williams or the user will be able to input which seats are taken when the customer orders them. The user will be able to input a letter, into the coloured cells (which represent the individual seats) and the ticket will be booked. The price from the seats will be added together and shown on this worksheet but will be shown in more detail on the profits and loss sheet.
The ticket types available are as follows:
- Adult (represented by ‘A’) price £5.00
- Child (represented by ‘C’) price £3.00
- Concession (represented by ‘X’) price £3.50
- Disabled (represented by ‘D’) price £3.50
I will use these prices in the formulas I create.
The picture on the next page shows the layout of the seating plan. Each blue square represents one seat. The user can simply input the letter of the appropriate ticket, and the costs will be calculated. This is done by using formulas. By having a diagram layout, it is possible to see quickly when the performance is sold out. I will also include a cell that says how many tickets are sold and how many are left.
I will make the system so that when a ticket code (‘a’, ‘c’, ‘x’ or ‘d’) is entered, as a ticket has been sold, the cell will change colour. I have decided to make this a darker blue.
To make this happen, I will have to use conditional formatting.
To calculate how many tickets have been sold, I will have to enter the formula =COUNTIF(Seats, “?”) into the cells that represent seats. This formula will calculate the number of seats that have been sold and this information can go into the table shown below. This is positioned by the side of my seating plan layout. The text boxes indicate what formulas will have to be entered to get the correct results.
This now should have created a fully working seating plan worksheet. The number of tickets sold and the total money made should have been calculated.
Detailed Design for the Data Base Worksheet.
The data base will hold the customer information. There will be contact details in case people who have brought tickets need to be contacted with extra details. For example: if the performance is cancelled or to contact them information on future events.
To begin making the data base, I will insert the names of the fields that are required. These are: Name, Address, phone number … ect. The top fields of the data base are shown below.
To enter the data, Mrs Williams or the user will have to enter the customer data herself via the user interface. The data will then be entered into the data base by using a macro
I will use formulas to calculate costs. I will then drag the formula so it is used within the whole column.
This is the data base sheet completed
Detailed design for Profits and Loss worksheet
The profits and loss worksheet is the worksheet in which the user can clearly see if the production is going to give the school a profit or a loss. This information must be clearly displayed.
To make this work sheet, I will have to go through the following steps:
Firstly I will write the list of inputs that the school has, below this I will write the list of outputs.
I will write a total amount for inputs and a total amount for outputs at the bottom of each list. To work out the totals, I will need to enter a formula.
When these totals have been worked out, I will be able to make another cell show the same data by using the formula ‘=b8’ or ‘=b18’. It is possible to add new incomes and outcomes if the list needs to be extended. I have left space for extra items but if need arise; it is simple to insert a new row.
By making this box filled white and with a thick border, it makes it stand out. It will hold all of the most important information where money is concerned. With one look at this sheet, the user will instantly be able to tell if the play is in profit or not.
I will make it so that when the total profit is negative number the font is red, and when it is positive it will be in black. It will look like this:
To make this happen, I will have to use conditional formatting
This is the profits and loss sheet finished.
Detailed Design for User Interface
To make the user interface I will have to use lots of macros.
I will firstly make the buttons that navigate u around the system. This is a simple macro to record as it just involves clicking on the appropriate sheet. I will then assign the macro to a button, and edit the text on the button.
To enter the data about ticket orders, a more complicated macro is required. I will copy and paste each piece of data into the data base sheet and finally clear the data. I will then assign this macro to a button. The result should be that when the button is pressed, the data is entered and cleared from the user interface instantly.
I will finally add a graphic, as this will be the first page the user sees upon opening the system.
Re-usability
The seating plan worksheet is re-usable. The seating layout for the hall is unlikely to change for other events. This means that the system can be re-used for other events.
The database sheet can be re-used as the fields needed are also unlikely to change even if the school is selling tickets for a different performance. Data can easily be deleted from the database and this allows the data base to start organising a new performance.
The profits and loss sheet is re-useable year after year as the formulas will still work even if all the inputted data is deleted from the system.
The user interface uses a macro. The macro will be re-usable. New data for a different performance can be entered, so long as the required fields are the same.
Implementation
Implementation
On the next pages, I have placed several views of my computer screen as I was making my system on excel. These annotated screen dumps show the stages that I went through to create my system.
Making the seating plan worksheet
I began making this design by drawing the correct layout of seats. (the user, Mrs Williams, had previously checked this) the screen shot of this is shown below…
Next, I drew out the table area of this work sheet in which the data was to be stored and the formulas were to be entered…
I then also decided to add a key, so that if the user forgot or was new, they would be able to see which letters represented each ticket type in the worksheet. The key I made is shown below…
The font I chose to use was comic sans. I think this font is very clear and easy to read. This is very important to the system as data cannot be miss-read.
To make the system count how many of each ticket type had been sold, I had to give a name to the seating cells.
I called them Seats. This is displayed when the appropriate cells are
Highlighted as below…
I next entered the formula to count the correct symbols. These are shown below in a screen dump that shows the formula used…
Other formulas that I had to use in order to make the system work are shown below. I needed to work out the amount made from each ticket type, how many tickets were remaining from a total of 400, and the number of tickets still remaining for disabled people and how much money had been made in total.
I also made the decision to include a key
to show the user which letters represent
each ticket type in case they forget or it
is a new user.
Making the profits and loss sheet.
This worksheet calculates the amount of profit made or the amount of money being lost. This work sheet involves using a number of formulas.
I formatted the cells into accounting so that could be displayed as currency with 2 decimal places. This makes it clearer that this sheet shows information to do with finance.
I wanted to make the totals stand
out more so I did this by displaying
them in the following way…
I feel this makes them stand out. I also used a formula to turn the total profit red if it is a negative figure. I did this by using conditional formatting which is shown below ………
This is the final image of the profits and loss worksheet……
I also decided to add in a series of cells that show how many of each ticket has been sold. I did this by using the formulas I used in the data base sheet. See below ……
Making the data base worksheet.
This was very simple to make, though a few simple formulas were required along with some cell formatting.
I laid out the field headings for each column where the data will be entered. There is space left at the op of this worksheet encase I decide a macro needs to be entered.
To get the data in to the database, I have a used a macro that copies the information from the user interface to the data base. The macro enters a new row when new data is added so the list extends on its own.
I also used validation on this worksheet. I added the amount of tickets sold by using the formula =SUM(E:H) and the total number of disabled tickets sold by using the formula =SUM(H:H). I then used validation to make sure the amount of tickets sold doesn’t go over 400 and the amount of disabled tickets sold does not go over 60.
These two screen shots show my validation.
I also decided to add in the other totals for the tickets sold. This will make it easier for the user to enter the correct amount on the seating plan worksheet as they can check that the amount of tickets sold and the amount of tickets booked in the seating plan are the same.
I used the following formulas to get this result …
=SUM(E:E) , =SUM(F:F) , =SUM(G:G)
I also added a macro to link the data base sheet directly either the seating plan sheet so that the user can quickly book the tickets in to the seating plan system when new data is received.
Making the user interface
The user interface is the first sheet to open and the front page to my system. The sheet contains macros that quickly link you to the other pages.
I recorded the macros
then assigned them to
the shapes ……
I also have the part of the system where you can enter the data for the customer. I recorded a macro so that once the data is typed into the spread sheet; all that needs to be done to enter the data into the data base is to press a button.
Finishing the seating plan worksheet
I used conditional formatting to make the seats change colour when they have been sold. This just makes it easier visually to see what seats have been sold.
This is the result, as you can see, it makes it easy to tell how many seats have been sold at a glance, but the text in the cells is still readable.
After talking to my end user, Mrs Williams, once again, she told me that she was very happy with how the system worked. You can see the user feedback in the evaluation section of my work.
Testing
Testing
Mrs Williams has had a few orders for tickets for concert. She gave me the information so I can put it into my system to see if it works. She gave me the figures I should get out at the end. I can compare the correct figures with those that my system produces and I can see if my system is functioning correctly.
Sammy Singleton ordered 4 adult tickets and 2 children tickets. Her phone number is 3443 7363828 and her email address is
Johnny Cook ordered 2 adult tickets and 2 concessions tickets. His phone number is 8778 6498239 and his email address is
Gary Small ordered 1 adult ticket and 1 disabled ticket. His phone number 7567 2744376 and his email address is
Kerry Davison ordered 4 adult tickets and 2 children’s tickets and 2 concession tickets. Her phone number is 0665 8725364 and her email address is
Jack Cooper ordered 5 adult tickets. His phone number is 8765 8987487 and his email address is
After I have put the above data into the data base and seating plan, I should see that:
- A total amount of 25 tickets have been sold. 16 Adult tickets, 4 children’s tickets, 4 concession’s ticket and 1 disabled ticket.
- The total amount made by ticket sales should be £109
- The total input should be £209.50
- The total output should be £182.00
- The profit being made should be £27.50 and should appear in black
The macro I used to enter the data into the data base works because when I pressed the macro button I made, the data appeared correctly in the data base sheet.
A new row is inserted automatically when a new piece of data is added.
The data base work sheet also has these figures on it…
These figures match those in the testing data shown on the first page of the testing section.
The finance sheet displays the following figures…
My system must be functioning correctly because the figures shown in the worksheet match the expected results.
The macros on the user interface that link directly to the other sheets work. And the macro that is on the data base sheet that links to the seating plan page works.
Evaluation
Evaluation
In this section I will evaluate the effectiveness of my system……
Have I achieved all of my objectives?
The objectives that were originally set by my user Mrs Williams were as follows…
- Create a system that is easy to use and understand that helps with the organisation of the annual Christmas concert.
- Create a user interface or a front end that the public will see and enter information in order to buy tickets. The data will automatically be put into the database.
- Show a seating plan of the hall that easily be updated as seats are ordered. Possibly use colour to make it easy to understand.
- Have a sheet for the organisers to see to show how much profit, money there is to spend, amount of funding, money going out…
These will constantly update when new data is added.
These should have been met ……
- Create a system that is easy to use and understand that helps with the organisation of the annual Christmas concert.
I feel that the system I created works in a way that is very simple to use. The system does make the organisation of the concert much easier and simpler. I think by making the texts clear and leaving keys and instructions in the system, I have made it much easier to use. Even if someone new or different to my user tried to make the system work would be able to use it.
- Create a user interface or a front end that the public will see and enter information in order to buy tickets. The data will automatically be put into the database.
I made a user interface. It is the first thing you see when the system is opened. I used a macro that enables the data to be instantly inserted into the database. By using this method, it makes entering customer data quick and easy.
- Show a seating plan of the hall that can easily be updated as seats are ordered. Possibly use colour to make it easy to understand.
I created the seating plan sheet. I used colour to represent which seats are disabled and which are not. The seating plan is an exact copy of the school hall. I no this because I copied the plan provided to me by the user. I have made it simpler for the user to book the tickets in to particular seats by using a simple code. This also enables the amount of money being made to easily be calculated. There are two tables, one saying how many tickets has been brought, and how many have been booked in. By looking at this and making sure the numbers match, you are able to see if the correct numbers of tickets have been entered into the seating plan.
- Have a sheet for the organisers to see to show how much profit, money there is to spend, amount of funding, money going out…
These will constantly update when new data is added.
I have made a sheet which clearly shows how much profit the performance is currently making. The figures shown are constantly updated because of the formulas I have included. As well as clearly displaying the profits, my system also shows how much money in total is coming in, and how much is being spent.
User Feedback
I have shown my completed work to my end user and she gave me the following comments…
“The system is very good and will be of great use to helping the school run and organise the performance of the Christmas concert. I like how all of the calculations are automated. It will make things simpler and there is less chance of error. I like how you can tell at a glance that we are in or out of profit. This will be very useful. It may have been better if you had included a way in which ticket prices could be changed. Over the coming years, if we reuse this system, we may want to eventually alter ticket prices. Also, the graphic on the user interface appears unprofessional. I think that either it should be replaced or removed completely. I think it may be useful if we could sort the data in the database by using different criteria. I would find this useful when looking at sending information to each customer. Also, I can see it being a problem that disabled tickets can be booked anywhere on the seating plan. It is possible for someone to make a mistake and book the disabled ticket into the wrong part of the seating plan. This could cause problems.”
Comments on User Feedback
After reading the comments from my end user, I feel that she is pleased with my end result. However there are changes I feel could be made if the need arises for me to update and improve my system…
- Include a way in which ticket prices can be altered.
This is possible to do. I would have to include a cell on one of the pages and put the price of tickets in it. I would then make my automatic calculations of ticket prices include the cell, rather than typing the price in the formula. It would make it simple for the user to change the ticket price, as all they would have to do is to change the amount in the cell with the price in and all other data would be altered in the system automatically.
- Remove or change the graphic on the user interface.
It is simple to remove the graphic. It can just be deleted. I could replace it with a graphic of the end users choice. If Mrs Williams provided me with an appropriate graphic, I could scan it into the computer and paste it onto the system.
- Making sure disabled tickets cannot be booked into the wrong part of the seating plan.
I can use an IF statement to make it so that when a letter D is entered into the light blue cells, a box will pop up telling you this is not allowed. This will solve the problem, as disabled tickets will only be able to be booked in to the darker blue cells.
- Filter data with different criteria.
It is possible to allow the end user to be able to filter the data in the database using different criteria. We can use filtering on excel. To do this, we use the option ‘filter data’ that is found on the data drop down menu. This allows certain criteria to be selected. This is what the data would look like if I used filtering.
Thank you for choosing to use this booking system. The system will help in organising the annual Christmas concert at the school. This guide will tell you how to set up the system and how to get the most out of it.
The following section will take you through step by step on how to start up and load the system onto your computer.
Installation
The program comes on a CD Rom. To install the program simplify insert the CD Rom into your computer. You can then run the CD Rom and click the correct file to open and run the system. You can then save the file to your system.
Starting the system
The system works on Microsoft excel. To begin the system open excel and open the file called ‘the booking system’. Or, you can set up a link to the program from the desktop. To do this you can click the file and make a shortcut.
Parts of the system
The system consists of 4 worksheets. They are called: User interface, Seating Plan, Data Base, Finance.
User Interface
When the system is first opened, the user interface appears. This is the worksheet that allows you to insert the data of a customer simply and easily into the database sheet. Also, there are links to the other worksheets so that you can quickly navigate your way around the page.
The Seating Plan
The seating plan is where you can plan where people will be sitting during the performance. You can also visually keep track of how many tickets have been sold. Also several financial aspects are calculated on this page.
The Data Base
The data base stores customer data. If the need to contact people who have placed orders arises, then the information can be found here.
Finance Sheet
This sheet shows all of the figures about the performance. It shows how much money is coming in, being spent and what profit is currently being made.
Using the system
The system is fairly simple to use. This section of the user guide will take you through how to use each worksheet individually. The worksheets are linked but it is easier to teach you how to use them when looking at them one at a time.
Using the User interface
The user interface provides you with a quick and simple way to enter and record customer data. The user interface is the first sheet that you will see upon opening the system. You can either use the buttons to go to a different page or you can enter the customer data.
Entering the data
To enter the customer data you simply have to fill in the form provided. Type, using the keyboard, the data that you wish to put into your system. You should type the information into the box next to the field name. When you have filled in the form it should look something like this ……
Using the navigation buttons
By clicking any of these buttons, you can be directly linked to any of the other sheets in the system. Using this method of changing sheets is quick and easy.
You can also navigate your self around the system by using the tabs at the bottom of the screen. You can flick between these to display the other sheets in the system.
Using the Seating Plan sheet
The seating plan is the sheet in which you can organise where people will be sitting on the night. You will be able to see visually how full the hall is. Also you can see how much money ticket sales are making. (this information can also be found in the finance sheet.)
Entering data in to the seating plan
For the concert, there are four types of tickets available. For each ticket type a different letter is used to represent it. Below is the code that is used. This code is also displayed on the seating plan sheet.
When entering the ticket type into the
seating plan, use the single letter that
represents the ticket type or the system
will not function correctly.
To enter the data into the seats, simply click the box, or seat, and enter the correct letters. Below is an example of what the seating plan should look like once data has been entered……
Finance on the seating plan sheet
On the seating plan worksheet you can see that some matters of finance are shown. The figures tell you how much has been made from each ticket type and how much is being made in total from ticket sales.
You have to keep track of how many tickets have been sold and how many have been booked. You have to make sure that the numbers in the table that show how many have been booked is equal to the numbers n the table which show how many have been brought.
Using the database sheet
The database sheet is to help you keep track of customer data. If the need arises and customers need to be contacted, if the play is cancelled, you can contact people to tell them. This is where the data is stored from the user interface.
There are several other features on this worksheet. The amount of tickets sold is displayed. When too many tickets have been sold, the system will tell you that too many tickets have been sold.
There is a button on the database that directs you directly to the seating plan. This is so that you can quickly book new orders into the seating plan.
When data is entered from the user interface into the database, a new row is automatically added. You don’t need to organise the data, it will automatically update and extend the list.
Using the finance sheet
The finance sheet displays how much money the school is spending and making in a clear and organised way. Inputs, outputs profits and loss are all displayed on this sheet.
Adding new inputs and outputs
If the school has more money to put into running the play or amounts change, you can update the system to take the money found into account.
This will alter the system and the new amounts will be taken into account when the final amount of profit and loss is shown.
If more incomes and expenditures need to be added, and there are no blank spaces, follow the following instructions…
The other parts of the finance sheet only display information. The information is automatically updated when data is put into the other parts of the system.
Saving your work
Once you have entered more data into your system, you will need to save the changes. To save your work, follow the following instructions…
Printing your work
If you ever need to print your work, or need a hard copy of the data, follow the following instructions…
First, select the sheet you would like to print by opening the correct worksheet. (You can use the tabs at the bottom of the screen)
You can then highlight the area you would like printing. In this case, we will print the customer data from the data base sheet.
Then, click ‘File’
And ‘set print area’
Then you can click ‘print’.
Recently asked questions
Is it possible for me to alter the formulas in the system?
No it is not possible. The system has been protected so that formulas cannot be altered. This means that if the correct data is always inputted, the answers will always be correct.
When I print a sheet, will I print all four sheets or just the one?
Only one sheet will print each time. The sheet that will print is the one displayed on screen.
If you are having further problems with your system, you can email your problem to the following address and we will get back to you as soon as possible with helpful advice.
[email protected]
Or you can write to the following address with any queries.
System Design
Nottingham
NE3 HU3