I added my logo to my pack and created a image to go on the front and inside of my pack folder. I like putting all the pack together at the end once I had designed everything for it; it gave me satisfaction and felt a sense of achievement. The worse thing about making this pack folder was finding all the measurements for the design; it was really confusing and I kept getting it wrong.
I ask people what they thought and gathered feedback so I could make a version 2, you can see this by following the links at the bottom.
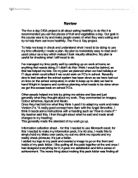
Makeover cards to help and show people what they could eat and make with different vegetables and fruits. We needed a recipe and a picture of what the fruit should look like once it had been made. The information pack is for people who just want to try something new; something quick and simple that they can enjoy. The makeover cards were A3 size and fit into my information pack. At the bottom of this page you can find links which will show you my first version that I made and then my second version I made with improvements and Feedback.
The best thing about my makeover cards is that they aren't too long to read and are attractive and easy to use. I liked making these cards because again there all about designing them on graphics software which I find fun. The most challenging thing about making the makeover cards were finding or taking stock images of fruit and vegetables and images of the fruit and vegetables once they had had their makeover, it was just hard to find the images but I eventfully found images on websites that provided them free for certain conditions which means I had to show where I had got the images from by tagging the images with "provided by freeimages.com" etc. I used adobe Photoshop to make my makeover cards but I tried using macromedia fireworks but I found it really hard so I solved this by going back to using Photoshop; I would recommend this program.
Teacher Said
“A really good concept here Sam with the Angel Smoothie. I think it needs some instructions with a heading such as “How to make it”. Also you could have a heading “What you need”. The white text works well but the new labels will give you an opportunity to add an extra bit of colour. Very good – well done!”
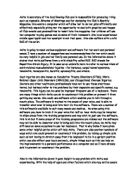
Digital posters - We made our digital posters for children aged between 9-12 years of age; we had to make them look attractive and interesting, we did this by using Music, animation, attractive colours and word art. Hopefully they will find some of the information on my poster and take something from it.
This is a picture of my Digital poster
I made my digital poster by using a combination of Adobe Photoshop and Power point. The hardest part I thought was creating the timings for animations and using the master templates; I also linking pages hard as it was really confusing and it took me quite a long time to do. I enjoyed choosing the colour code and generally designing the look of the poster; creating the graphics that went on the poster (using adobe Photoshop)
Sophie heaven said "it flows really well and everything looks neat and matches"
I needed to add more information which would help anyone who was looking for a healthier alternative to snacking on junk food.
My database is basically used to search information on fruit and vegetables. I created my data base structure using Microsoft access; once I did that i Imported data records from notepad. I made a database to store information about Five a Day portions. I did this by importing the fruit and vegetable dataset and recording what records were rejected. We replaced rejected records with new ones which we found from websites like 5 a day NHS site.
I designed Queries so I could get a search results for two different fruit or vegetables; so it will give me or other users an option of searching for the colours of the fruit or vegetables. I used the report wizard (based on a query) to make the “Eat Me Drink Me” Reports. I customized it with my own banner, colour scheme, logo and changed the font. I created my Banner for my Database using adobe Photoshop. I made it colourful and bright; I used the same banner on every single piece of work; this is so it matches and isn't all mixed up. I saved one PSD banner so I could edit just the text for banners I needed, then I saved the separate banners as JPEG's and inserted them at the top of my work. I inserted my logo at the bottom of every report; this makes it look consistent and smart.
I thought creating the searches so that other people could find fruits or vegetables was challenging and my searches wouldn’t normally find any fruit; what I was doing wrong was making the input information to detailed which generally never found any Fruit or Vegetable. I simply made the queries more open.
Sophie Heaven thought mine was very useful and said she would use it. Thomas Skillington said "oh I like that", he said I could maybe make my logos on every report a big smaller.
Documenting the “Eat Me Drink Me” Reports!
I made a reality check - Reality check is a way for people to check if they’re eating enough fruit and Vegetables, using spreadsheets; if they are not eating enough fruit or Vegetables produce the spreadsheet will tell them what fruit or Vegetables produce they need to eat to restore a healthy diet. I created the data collection sheet using Microsoft excel, we used lots of different formulas to calculate information to show us what our test buddy's were eating; other people could use this to check what they’re eating as well.
When users use my reality check to see if they are eating what they need to eat they have they use drop down box's to select their options; this makes it easier for them and they don't have to type out what they need; this makes it easier and not as tedious for them.
I enjoyed testing my reality check out because I made me happy to see it work; the pleasure of all my work coming together.
Sources selection - I had to find sources from anywhere I could e.g. the internet, shop, friends and information centres, these sources were either Primary sources or secondary sources; meaning primary where sources I had gone created for example taking photos of fruit. Secondary sources would count as sources which I haven't created.
It is vital I don’t break any copyright laws while doing this project so I had to make sure everything I used from the internet whether it be images or music or any type of media from the internet was ok to use or had TOS (terms of service)
Sources
Conclusion – I have enjoyed doing most of the DIDA project; I found doing the graphics for the project really pleasing. Although I enjoyed doing the work I found some of the work really hard; I struggled to understand what planning was at the start of the project but slowly it began to make more sense and I could begin to work on it. Nearer to the end of last year we had some problems with the schools I.T system so for a few lessons we couldn’t do our work at school; but I did some work at home and I was able to keep mostly up to date.
Over all I think this project has been fun apart from a few tedious tasks that we had to overcome but once we overcame them it was all good.
I think I will take I.T further and may decide to do I.T for A- level