This software is not appropriate for my project as it costs a lot of money. It also requires training to use, which will have to be paid for. It is a very complicated program and does not contribute to my needs.
Quoted from the Gnumeric website:
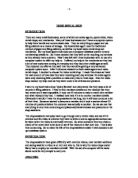
‘The gnumeric spreadsheet is part of the GNOME desktop environment: a project to create a free, user-friendly desktop environment. As every other component of GNOME, Gnumeric is free software and it is licensed under the terms of the GNU GPL’
I will not be using the Gnumeric software, as it is very simplistic and does not produce graphs, which I will need for my project. This software is definitely inappropriate.
For my project I am going to use Microsoft Excel. I feel this is the most appropriate spreadsheet software for many reasons:
- I am most familiar with this software
- It is easy to use. The program requires very little training if any.
- It is free to use as it comes as default on most computers and it is the most widely used spreadsheet software.
- The software has a help menu so you can go through the tutorial for help, if you do get stuck.
- Another advantage that Excel has is a variety of graphs can be plotted.
Jack Challis can use this software for a number of things. He can work out how much he earns weekly and how much profit he has made after expenses etc. He can use it to identify which are the more popular videos. The system must be able to do all the calculations automatically to get rid of human error. The software will need to total profit each month.
The hardware which will be used is:
- Monitor – to view the data
- Keyboard – to input the data
- Mouse – to navigate around the computer
- CD drive- this lets you run programs and play music CDs etc.
Computer
- Processor: A processor controls the functions of a computer and allows you to do what you need.
- RAM: temporary storage, which is used which is used as soon as the computer is turned on
- Hard drive: stores all the information and programs in the computer.
- Video card: converts computer signals into a picture that you can see on the monitor.
- Sound Card: converts computer signals into a sound format.
Objectives / User Requirements
There are several different objectives that Jack would like the new system to fulfill. These are:
- Automatically calculate and produce monthly sales figures for:
- Video rentals
- Video purchases
- Late fines
- Food purchases
- Automatically calculate and produce yearly sales figures (and a running total) for:
- Video rentals
- Video purchases
- Late fines
- food purchases
- Produce an annual profit and loss statement
Analysis
Evidence of path followed in solution approach
In order to ensure that the project did not overrun, I created a Gantt chart (see Appendix A) to detail when each part of the project would be complete. I spent several weeks researching the software to see what functions and features it offered.
Source of the Information
The data that will need to be collected is:
- Weekly video rental figures
- Weekly video sales figures
- Weekly food product sales figures
- Expenditure and overheads
At present, the rental and sales figures come from a sales book. When a video is rented or purchased, Jack Challis records the date, membership number, video number and amount paid in this book. When people bring back videos late, they are charged a late fine. These are also recorded in this book. He totals this figure at the end of the day and checks the amount against his till receipt. This till receipt shows two figures, one figure shows income generated from videos and the other figure shows income generated from food products.
The expenditure and overheads of the business are collated in another book. These figures are calculated at the end of each month. The figure varies each month as the company does have unforeseen expenses which vary from month to month, such as new shelving, removal of graffiti etc.
I shall use both of these books as the source of data collection.
In addition to financial data, I shall be collecting data on the videos and members of the shop. Jack Challis would like clearer information concerning: which are the most popular videos, which videos have not been rented for some time, who his most frequent customers are etc. I can collect this data from his sales book.
All of the data and information that I need will be coming from Jack Challis. The methods I shall use are interviewing and shadowing.
Implications of data types
There are three different data types that can be entered into a spreadsheet. They are:
- Text or labels
this means text that has no numerical data
- Values or constant
this means any number
- Formulae
this means a mathematical equation used to calculate
I will be using all of these data types in the design of my spreadsheet. Text will be used to label rows and columns, eg: “video rental” or “advertising costs”. Values will be used in columns such as “membership number”. Formulae will be used to calculate amounts such as “March monthly income” or “Total Advertising for May”.
Diagram of data inputs / process / outputs
Design
Designs for the solution
I intend to have two workbooks, one for income and one for expenditure. The expenditure workbook will generate an annual profit and loss statement.
Income
The income workbook will be divided into monthly worksheets, starting in the new financial year. Although, Jack Challis keeps his records on a weekly basis, I decided to work on a monthly basis because a worksheet for each week would become unwieldy and it is very easy to sort figures by week using Excel if Jack needed to.
The general layout of this worksheet would include columns for date (autogenerated), membership number, video number, amount spent (video or food product). The financial columns would be automatically totalled for the month using a =sum formulae.
The totals for each of these 12 worksheets would be reflected in a final worksheet which would give an annual account of the business.
This workbook will be able to produce graphs showing percentages of income (video, DVD, rental, sales, food sales, late fines). Reports will also be generated showing which videos are the most popular, when is peak time for sales, who are good/bad customers. Some of this information can then be used to target specific customers and to make purchasing decisions.
The general layout of the monthly income worksheet will be:
Formulae and functions that I am going to use include:
- Date
This column will have a formulae to generate the current day’s date: =TODAY()
- Cost
This column will be formatted for currency to two decimal places. The column finishes with a monthly total. The formulae for this is =SUM(E2:E14). The final figure in the formulae will alter depending on how many transactions have been made.
The general layout of the yearly income worksheet will be:
Expenditure
The expenditure workbook will also be divided into monthly worksheets, starting in the new financial year. This worksheet will cover all expenses such as premises rental, maintenance, purchasing stock, advertising, services (gas, electricity, phone etc). This workbook will be connected to the final worksheet on the income workbook so that a total net income can be reached.
This workbook will be able to produce graphs and reports showing expenditure.
The general layout of the expenditure worksheet will be:
I intend to use Arial font and use a minimum of colours. I shall use colour to highlight important information such as total figures.
Solution broken down into sub tasks
The two workbooks have links within the workbooks and with each other. All of the monthly worksheets in the Income workbook are linked to the final worksheet which gives a yearly income total. The income workbook is linked to the expenditure workbook to create an annual profit and loss statement.
User comments recorded
I showed my designs to Jack Challis, who is going to be the sole end user for this system. We discussed whether the designs would fulfill all of his requirements. We realized that at present the end user would need to manually sort each transaction into transaction types to find out how much income was from each different transaction type: video sale, video rental, food sales, late fine. This resulted in a change to the monthly income worksheet. This change involved the creation of the column ‘ transaction type’ so that Jack could see how much is spent on rental, purchase, late fines and food purchases without having to sort these manually. Another addition was to have a column which showed a running total for each of these transaction types.
This change has meant that at the end of each monthly sheet, I will calculate total income for each transaction type. I will use the formulae SUMIF, eg: =SUMIF(C2:C14,"rental",E2:E14). This formulae gives the total of all rental transactions. I will use these calculations to produce monthly graphs
Validation / Verification / Backup / Security
The worksheets need to be validated for several reasons. Examples of validations that have been put on the Monthly Income Worksheets are:
- Membership number
I will put an input message validation on this column. The validation will be that a membership number must be added unless the only purchase is a food purchase.
- Transaction type
Eg: rental, sale, late or food. This column will also have a validation to ensure that one of these transaction types is entered.
- Video number
I will validate this column to ensure that if a number is input, it must be between 0 and 2000 (video numbers have reached 1600 so far, so this leaves ample space for new releases)
I have discussed with Jack Challis the need for the worksheets and workbooks to be regularly backed up using the CD facility on his computer. We also discussed the need to assign a password to the workbook and to remove the sharing facility incase anyone (for example, one of his children who often accompany to the shop) accidentally accesses or corrupts the data.
Test plan
I tested the formulae that I have used in this design by using valid, invalid and extreme data. The following are some of the tests that I made on the monthly income worksheet:
Test data identified
After I had created the spreadsheets, I used test data to make sure that the spreadsheet worked as it was supposed to do. The data I used was the data written in Jack Challis’s books for April last year. I then double checked the figures generated from the spreadsheet against the figures from last April.
Use and Implementation
Relevance to design
The final sheets that I have made follow the design. The following three screenshots show the three different worksheets and the original design that I created.
Monthly Income Worksheet
Design
The column ‘Transaction Type’ was added to the design after further discussion with end user.
Implementation
The implementation shows how I have added a separate column which breaks down the monthly total into transaction types. This screen shot also shows a graph of income by transaction type.
Yearly Income Worksheet
Design
Implementation
Annual Profit and Loss Statement
Design
Implementation
Errors corrected
The errors that I encountered whilst making my spreadsheets were mainly to do with formulae. When I set up the monthly income sheet, I needed the formulae to calculate total income for each transaction type. This involved using the formulae SUMIF. I needed to look at the Help section on Excel several times before I perfected the formulae.
I also had difficulties linking cells in one workbook to another workbook as I had forgotten to put the name of the linked workbook in square brackets.
Annotated evidence of implementation
The following screenshots show all the worksheets that I have made:
Details of implementation process
I showed my final solution to Jack Challis to show him the system in action. This made me feel satisfied that there wasn’t any information that I had forgotten to include, such as different types of expenditure.
I used the help section of Excel to aid me in the design of my formulae, validations and functions. I have already detailed some of the validations that I have made in my worksheets. I applied validations to many of the columns to ensure that the data was valid.
Evidence of testing
When I was satisfied with the implementation of my design, I ran through my test plan to check that the system was working as expected. My findings are as follows:
Annotated copy of testing
When testing the spreadsheets, the main error message that the system produced was when I had made mistakes with the formula:
One other error that appeared was when I incorrectly spelt the name of a worksheet that I was trying to link to another worksheet. I spelt ‘April’ as ‘Aprl’ and the system produced a ‘File Not Found’ box.
Evaluation
Evaluation against the objectives
The objectives from the Identification section are:
- Automatically calculate and produce monthly sales figures for:
- Video rentals
- Video purchases
- Late fines
- Food purchases
- Automatically calculate and produce yearly sales figures (and a running total) for:
- Video rentals
- Video purchases
- Late fines
- food purchases
- Produce an annual profit and loss statement
I think that the system I have implemented meets each of the objectives identified. The Monthly and Yearly worksheets cover all the objectives covered under the first two main objectives and the Annual Profit and Loss Spreadsheet covers the third objective.
User comments
After testing the workbooks thoroughly, I showed the final system to Jack Challis. He was pleased with the system and said that it meets all of his requirements. I have attached a copy of the questionnaire that I gave to the shop owner after he had tried the system for one month (Appendix B).
Suggested improvements / changes in the future
Although my system meets all of the objectives and requirements of the end user, there is still room for improvements and expansion.
An area that I would improve would be the user interface. If I had more time to further increase my knowledge of Excel, I would have designed a more user friendly interface in the layout of a form. This form would have buttons to carry out such functions as: add new transaction, view current day’s accounts etc.
Jack Challis is currently considering installing a photo development service to his business. If this plan goes ahead, it would mean that the system would need to be expanded to include this type of transaction.
Appendix A
Appendix B
Chislehurst and Sidcup Page