A Data Handling Project for Used Car Prices
GCSE Mathematics Data Handling Project
A Data Handling Project for Used Car Prices
For this data-handling project I will be investigating how age affects price. To do this I will,
* Take a random sample of 50 makes of used cars by using the random sample button on a calculator,
* Using this sample I will find the age and price for each car and record this data in tally charts,
* I will present the data from the tally charts in various graphs and charts with explanations.
* I will then extend my inquiry by investigating whether two separate makes of used cars have different ages and prices.
* Also to go further for my extended investigation I will look at magazines to find more current prices of used cars and compare it with the data I've been given, to suggest reasons for any differences between the two makes.
Hypothesis
I think that in general the older a used car is, the lower the price. This is due to the older the used car is, the more chance there is of it breaking down. This in turn will make the insurance fairly high, and the cost of ownership will increase dramatically, because the user may have to use a lot of their money on repairs. It will not be appealing to customers not only because of this, but also because of its physical appearance. It may look worn out on the interior and outside and will not have been subject to any modern conveniences, such as air conditioning and other design enhancements. All of these design enhancements would physically improve the used cars appearance, and the value of the car as well.
Collecting My Data
I obtained the information for my Data Handling Project from the Microsoft Excel spreadsheet, which was provided by school. I took a random sample of 50 cars using the random sampling button on a calculator. I collected the data in this way, because I would have used the actual data and by means of the random sample formula I ensured that my data was unbiased. I collected a sample of 50 used cars, therefore my data should be adequate and reasonably reliable, without taking too much time to record and evaluate.
My Random Sample of 50 Used Cars
Recording My Data
A Tally Chart to show the age of 50 used cars
Age
Tally
Frequency
IIII
4
2
IIII I
6
3
IIII
4
4
IIII
5
5
II
2
6
IIII IIII I
1
7
IIII II
7
8
IIII I
6
9
II
2
0
I
1
I
2
0
3
0
4
0
5
I
My data from the tally chart is discrete; therefore I have decided to display my results in a bar chart.
A Tally Chart to show the Prices of 50 Used Cars
Price
Tally
Frequency
0-999
I
000-1999
IIII IIII
0
2000-2999
IIII II
7
3000-3999
IIII IIII II
2
4000-4999
IIII I
6
5000-5999
III
3
6000-6999
...
This is a preview of the whole essay
2
0
3
0
4
0
5
I
My data from the tally chart is discrete; therefore I have decided to display my results in a bar chart.
A Tally Chart to show the Prices of 50 Used Cars
Price
Tally
Frequency
0-999
I
000-1999
IIII IIII
0
2000-2999
IIII II
7
3000-3999
IIII IIII II
2
4000-4999
IIII I
6
5000-5999
III
3
6000-6999
I
7000-7999
IIII
4
8000-8999
II
2
9000-9999
0
0 000-10 999
0
1 000-11 999
0
2 000-12 999
0
3 000-13 999
II
2
4 000-14 999
0
5 000-15 999
0
6 000-16 999
0
7 000-17 999
I
8 000-18 999
0
9 000-19 999
I
The Data from my tally chart is continuous; therefore I will present my results in a Line Graph.
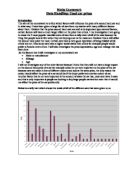
I drew up a Scatter Graph to show any correlation between price and age of the sample of 50 Used Cars, which would enable me to write a suitable analysis.
The Scatter Graph shows that there is weak negative correlation between price and age of the used cars. This is because as the age increase the price decreases.
Analysis
My data suggests that my hypothesis (the older a used car is the lower the price) was correct to some extent. The Evidence from my sample suggests fewer used cars are likely to be of ages 9,10,11 or 15, than any other age and that the modal class interval for price of used cars is likely to be 3000-3999.
Extended Investigation
I will extend my investigation by seeing if Ford and Vauxhall cars have different prices and ages. I will also observe the following hypothesis:
In general Ford cars will be cheaper and older than Vauxhall cars
I order to do this I will take a new sample. There are 15 Ford cars and 13 Vauxhall cars; therefore to ensure that there are equal Ford and Vauxhall cars, I will take a sample of 10 ford cars and 10 Vauxhall cars. I will use the Random number button on a calculator to do this.
My Random Sample of 10 Ford cars and 10 Vauxhall cars
Recording My Extended Data
I drew up tally charts as a more useful representation of the data, for Price and Age of Ford and Vauxhall cars.
Ford Cars
Age
Tally
Frequency
3
I
4
II
2
5
II
2
6
I
7
II
2
8
0
9
0
0
I
1
I
Price
Tally
Frequency
000-1999
III
3
2000-2999
II
2
3000-3999
II
2
4000-4999
II
2
5000-5999
0
6000-6999
0
7000-7999
I
Vauxhall Cars
Price
Tally
Frequency
000-1999
I
2000-2999
I
3000-3999
I
4000-4999
II
2
5000-5999
0
6000-6999
III
3
7000-7999
II
2
I will analyse the data for Price and compare the results for Ford and Vauxhall. This data is continuous; therefore I will use a histogram in order to do this.
Age
Tally
Frequency
2
II
2
3
0
4
III
3
5
0
6
III
3
7
0
8
0
9
0
0
I
Ford
Stem
Leaf
Frequency
000
595, 495, 664
3
2000
300, 995
2
3000
200, 995
2
4000
295, 700
2
5000
0
6000
0
7000
995
Vauxhall Cars
Stem and Leaf Diagrams
My data is grouped into class intervals; therefore to make it easier to read off the median values I decided to record the data in a Stem and Leaf diagram.
Ford Cars
Stem
Leaf
Frequency
000
000
2000
900
3000
495
4000
995, 976
2
5000
0
6000
595, 499, 995
3
7000
999, 499
2
I also recorded the mean, median, range for the data and because the data is continuous I will find the modal class interval instead of the mode.
Price
Mean
Modal Class Interval
Median
Range
Ford
3423
000-1999
3098
6400
Vauxhall
5295
6000-6999
5786
6999
Recording My Data for Age
I drew up tally charts to show age for Ford and Vauxhall.
Ford
Age
Tally
Frequency
3
I
4
II
2
5
II
2
6
I
7
II
2
8
0
9
0
0
I
1
I
Vauxhall
Age
Tally
Frequency
2
II
2
3
0
4
IIII
4
5
0
6
III
3
7
0
8
0
9
0
0
I
I considered the data for age of Ford and Vauxhall using bar charts.
Ford
Vauxhall
I will compare the ages for Ford and Vauxhall cars using a dual bar chart.
I will compare the mean, mode, median and range of ages for Ford and Vauxhall, so that I can receive more evidence to support my hypothesis. I will record the mean, mode, median and range to 1 decimal place.
Ages
Mean
Mode
Median
Range
Ford
6
4,5,7
6
8
Vauxhall
5
4
4
8
Analysis
The averages are higher or similar for Ford cars rather than Vauxhall cars. However the range is the same for Ford and Vauxhall cars. In general, although a small number of Vauxhall cars may be slightly older than Ford cars, on the whole the ages of Ford cars are higher than the ages of Vauxhall cars. Evidence from this sample to support this suggests that approx 7of 10 (70%) Vauxhall cars are ages 4 and 6 and 6 out of 10 (60%) Ford cars have ages 4,5, and 7.
The conclusions for age and price are only based on a sample of 10 Vauxhall cars and 10 Ford cars. I could extend this sample or repeat the same exercise to validate my results.
Analysis
The averages (mean, mode, median and range) are greater for Vauxhall rather than Ford. The modal price for Ford is1000-1999 and the modal price for Vauxhall is 6000-6999. The sample for Vauxhall was more spread out, with a range of 6999 compared to 6400 for Ford. The evidence from the sample suggests that 3 out of 10 (30%) for Ford are between the price 1000-1999 and 3 out of 10 (30%) for Vauxhall are between 6000-6999. As these results are only based on 10 Ford cars and 10 Vauxhall cars I could extend the sample or re-do the task to verify my results.
Scatter Graphs for the Price and Age of Ford and Vauxhall cars
I will show the correlation between Price and Age, by considering Ford and Vauxhall cars separately. I will plot separate scatter graphs for Ford and Vauxhall and the whole sample.
Analysis of Scatter Graphs
I can see from my scatter graphs that there is stronger correlation for Ford cars rather than Vauxhall cars. There is stronger correlation when the two makes of cars are taken into account separately. Also by drawing a line of best fit I can predict that a Ford car that is price £4000 will be approximately age 4 and a Vauxhall car that is price £6000 will be approximately age 2.
I can see form my scatter graphs that there is stronger
By drawing a line of best fit I can predict that a Ford car that is (price)
Will be (age)
Cumulative Frequency Graphs
I will show the cumulative frequency for age for Ford, Vauxhall and the mixed sample.
Age
(Up to and including)
Cumulative Frequency
Ford
Vauxhall
Mixed
2
0
2
2
3
0
4
2
4
6
5
2
0
2
6
3
4
7
2
0
2
8
0
0
0
9
0
0
0
0
2
1
0
Price
Cumulative Frequency
Ford
Vauxhall
Mixed
<1999
3
4
<2999
2
3
<3999
2
3
<4999
2
2
4
<5999
0
0
0
<6999
0
3
3
<7999
2
3
Price
Median
Lower Quartile
Upper Quartile
Interquartile Range
Ford
4999
4500
999
2501
Vauxhall
4999
999
6999
5000
Mixed
4999
4750
2999
751
I will use the cumulative frequency curves to find the median, upper quartile, lower quartile and interquartile range.
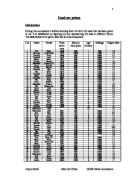
Further Research
I looked through a 'Motors' article in the 'Telegraph and Argus' to find any used Ford and Vauxhall prices, so that I could see if an modernized version of used car prices follows the same trend as before. I collected a sample of 10 Vauxhall cars and 10 Ford cars and then I recorded my results for price in a tally chart.
Price
Tally
Frequency
2000-2999
IIII
4
3000-3999
I
4000-4999
III
2
5000-5999
II
2
6000-6999
I
I can see from my tally cars that Ford and Vauxhall prices do follow the same trend as before even though they are up to date prices. Evidence from the sample is that the modal class interval for Ford is 2000-2999 and the modal class interval for Vauxhall is 5000-5999.
Price
Tally
Frequency
000-1999
0
2000-2999
0
3000-3999
0
4000-4999
III
3
5000-5999
IIII
4
6000-6999
I
7000-7999
II
2
8000-8999
Vauxhall Cars
Ford
Conclusion
Conclusion
From my results and my graphs I have found out,
* There is weak negative correlation between Price and Age,
* My hypothesis was correct. (The bigger the age the lower the price,)
* Even an updated used car list shows the same trend,
* The points on the scatter graph for Vauxhall's are more dispersed about the line of best fit than those for Ford; therefore this suggests that the correlation for Ford is better than Vauxhall,
* The scatter graphs can help when predicting estimates of price and age, by reading from the graph,
* The points on the scatter graph for the mixed sample of Ford and Vauxhall cars fit on a straight line better than on a curve, which means that the relationship is linear,
* The overall conclusion that I have come up with is that age does affect price and that Ford cars are older and cheaper than Vauxhall cars.
I'm not completely sure that the results I received are genuine; therefore in order to receive more reliable results I could have,
* Collected more data for both samples as some individuals fell outside the general trend,
* Taken a bigger sample of cars,
* Done statistical tests, so that my conclusion fitted more appropriately,
* Produced more graphs, charts, etc, each with a more detailed explanation,
* I could have also given some consideration to other reasons why price is affected i.e. engine size.
On the whole my results suggest that the older a car is the lower the price. This assumption could be a useful hypothesis for car dealers when they want to give an average buying rate of a car, to a customer, without having to check the book price.