Audrey Chung GCSE Maths
Introduction:
The title of my investigation is ‘A Survey to Study The Correlation Between The Genders And Their IQs of The Students from Year 7-11 in Mayfield High School.’ I am very interested in this subject. As there are a lot of males who claim that their IQs is higher than the females. However, the females disagree. Hence, I will investigate on this topic and prove by statistics to give us an answer.
My current hypotheses are that there is no correlation between the genders and their IQs from year 7 through year 11. I believe that there are no relationship between the gender and IQ because I think that IQ are from our DNA and also experience.
I will need to collect the information of every student from year 7 to year11 in Mayfield High School. I can find this information in the school network. ‘ Res on Maridor, SubjectResource, Maths, Data Handling.’ Inside the Data Handling folder, I will find an Excel folder called ‘ Mayfield Data’.
I have chosen these sources of information because it is secondary information and it is from Excel, therefore, it is very easy and convenient to work with. This data is reliable because it is posted on the school network. I will also check and ignore any strange results.
Sampling, Tables and Calculations:
I will collect a sample size of 50 students from each year. According to respective ratios of the number of male students to female students the following data will be selected at random. This is called stratified sampling.
This will be a fair sampling because the number of male students and female students are proportional to the respective fraction in various levels. And the selection is taken at random by the Constant Interval method that will be shown below.
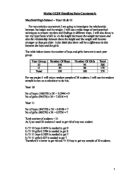
For example, in year 7, there are 282 students in total, 131 of them are females and 151 of them are males. Therefore, the number of male and female I have to use for sampling in the 50 students according to the ratio is:
151/282 x 50
Male=27 female= 50-27=23
=27/151 = 23/131
~1/5 ~ 1/5
Then select the first male student in every group of 5 male students. Select the first female in every group of 5 female students. In each group of students in every level I will be doing the calculation of:
- The Mean
- The Lowest IQ of the group
- The Highest IQ of the group
- The Median (Q2)
- The Lower Quartile (Q1)
- The Upper Quartile (Q3) and
- The Inter-quartile Range (Q3-Q1)
These data will help me to compare:
- The average IQ of male students and female students.
- The spread of the IQ of both genders from year 7 to 11.
- The time trend of the IQ of both genders from year 7 to 11.
In other to achieve the above aims, I will use ‘box-plot’ diagrams and ‘time series’. The box plot is good for comparing the spread of the distribution of the two genders because we can easily compare and see the inter-quartile range as well as the range with out being affected by singular cases. The ‘time series’ is also good to show the comparison between two genders and the development of IQ in relation to time.
Therefore, I deliberately choose those calculations because the mean is useful for comparing the IQs of different genders in different levels and for the study of time trend. The lowest IQ and highest IQ of each group, median, lower quartile, upper quartile and inter-quartile range are very useful to draw the ‘box plot’ diagrams which will be used to compare the IQ distribution of different genders. The tables will be as follow:
Year 7 (males)