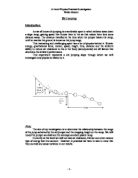
Diagram
Difficulties
In this experiment, there was a difficulty with which range of results to use, if we went to low then it would be hard to time how long it took to fall for example if we went under 40cm then it would take 0.42 secs to reach the floor. This measurement is hard to recorded accurately and get consistent results.
Safety
In this experiment, we must be careful that the experiment does not fall over as it is on a bench and could hit some one in the head if not properly secured.
Theory
This experiment or though relatively simple needs to have theory explained to see why we were doing the experiment.
As on object falls it has 2 main forces working on it drag and weight, the weight pulls it down to the ground and the drag lifts the case and fights against the weight. If the case is dropped from a height of for example 1m then it will fall to the ground in a set time T. At the start of the fall, it will fall slower than at the end due to acceleration. This increasing acceleration is caused by the drag gradually being out balanced by the weight. At a certain point of the fall the weight and drag are balanced this is called the terminal velocity. From 1m if the case is dropped it falls to the ground in T however the time when drag is biggest is t but the time when the weight has more force on the case is (T-t). Also the height can be measured for the length of drag and weight this is done by calculating that if when the height of the drag is bigger should be measured as x and when the weight is the larger force then it will be measured as V(T-t). When the drag and weight are of the same proportion to each other then this is called terminal velocity.
These results can be translated into a formulae which is
This can be simple fide by expanding out which will give
From this we can stat to see that if it is plotted on a graph and the results are accurate then it will be a straight line graph.
Which is equal to Y = mx + c
This is the formula for a straight line.
Conclusion
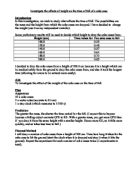
My results from this experiment show that the relationship of terminal velocity is constant. This means that as the drag increases then the lift decreases. The graph has some anomalous results such as at the height of 70 and 65 these are down to human error as this is the only reliable explanation for these results. Despite this the graph shows a good correlation between height and time.
From the height time graph we can see as the height increases it takes longer to fall to the floor, this is common knowledge but I have used scientific knowledge to explain it further, and from this information we can calculate the terminal velocity. We do this by using the equations from before and substituting the letter for the values of the time and height.
This will give me the terminal velocity for 1 meter. This is 0.952ms-1
Evaluation
My aim for this experiment was to derive an equation and to perform an experiment that would prove my equation correct by using a graph. As you can see I have produced a graph and it shows a straight line through the origin. This means that the equation must be able to be arrange so that it fits the Y = mx+c equation.
- H = VT + (X-Vt)
- Y = mx + c
The experiment had some flaws however the only major source of error was human error. If I was to do the experiment again I would have taken 5 readings for each height. Also to reduce the human error I would have a highly sensitive pressure matt where the case would fall therefore when the case lands onto the mat the timer would be stopped this would eliminate human error.