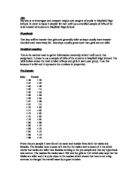
An investigation into the heights and weights of students attending Mayfield High School.
I have chosen Mayfield High School database to test the statement; "The taller you are, the heavier you are." I feel it will be better for me to use this database, provided by the exam board Edexcel, as it would take a large amount of time to design and produce my own questionnaires and gathering the information.
There is a lot of information on the database that I will not need, such as, eye and hair colour, favourite T.V. show and so on, as I will not be needing this I will delete all information other than first, second and surnames, year group, gender and also height and weight.
Once I have only the information needed I will arrange each pupil into their year group and gender groups, once I have completed this I will again arrange them into alphabetical order by the pupils surnames.
When each pupil is in order I will number every one of them, students in KS3, year groups 7 - 9, will be numbered 1 - 813, inclusive, and pupils in KS4, year groups 10 and 11, will be numbered 1 - 370, inclusive.
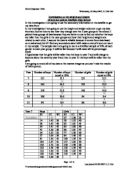
When reading through the height and weight columns on the database I realised some entries were wrong, or at least unconvincing, for example, a female pupil in year group 10 is being shown at 4.65m tall. As I think of height as feet and inches I will convert this below:
* 1 inch = 2.5cm
* 1 foot = 30cm
Therefore: 4.65m = 465cm
465/30
= 15.5 feet or 15 foot, 6 inches
5 foot 6 inches is far too tall for a girl of this age, or any other age, so I believe this data is wrong. Now I have noticed different pieces of incorrect data, these could have been from typing errors or maybe someone just not paying attention whilst inputting the data.
With the mistakes in mind I think it would be best if I took a random sample of pupils and exclude the rest from my investigation to try and avoid any of the mistakes getting into my investigation.
Other members of my class came to the same conclusion as me so we decided to save time we could choose the sample as a group.
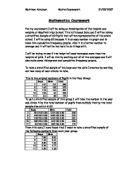
We decided we would select, at random, 15 boys and 15 girls from each year group. The reason for choosing the number 15 is because it is one less than a multiple of four; this will therefore make it easier to find quartiles and medians during my investigation. I will also pick three extra pupils from each year group in case any of my original numbers were pupils with incorrect information.
As I mentioned before I have numbered each pupil, this is so I can easily select pupils at random for use in my investigation. I will be doing this by selecting the shift then random key on my scientific calculator and multiplying the generated number by 1000.
For example:
* Generated number = 0.002
* 0.0052 x 1000 = 2
This is a fair way of doing this as I have no control over the pupils chosen to use in my investigation.
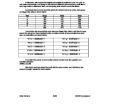
I ignored any numbers generated by my calculator that were outside the ranges of numbers I needed.
I entered each number onto a form to keep a record of the numbers I had chosen at random. Our teacher put the information onto the college intranet in order for all students could access the data when needed.
To show my findings throughout the investigation I shall be using the computer to form scatter graphs, stem and leaf diagrams, tables and also box and whisker plots. I will also be using text to show my findings throughout as well as the above mentioned ways.
Now I have completed my plan I am able to test my chosen statement:
"The taller you are, the heavier you are."
I am now going to show a scatter graph to show evidence of height and weight from plotting every pupil I am using in my investigation.
The reason for using a scatter graph to show this is because this type of graph can show any correlation there may be from plotting the data.
To help show any possible correlation I shall also show a line of best fit in my graph.
I believe the scatter graph will show strong positive correlation as I think that generally, people who are taller weigh more. Also the line of best fit should slope upwards showing that as the weight increases so does the height.
I have chosen Mayfield High School database to test the statement; "The taller you are, the heavier you are." I feel it will be better for me to use this database, provided by the exam board Edexcel, as it would take a large amount of time to design and produce my own questionnaires and gathering the information.
There is a lot of information on the database that I will not need, such as, eye and hair colour, favourite T.V. show and so on, as I will not be needing this I will delete all information other than first, second and surnames, year group, gender and also height and weight.
Once I have only the information needed I will arrange each pupil into their year group and gender groups, once I have completed this I will again arrange them into alphabetical order by the pupils surnames.
When each pupil is in order I will number every one of them, students in KS3, year groups 7 - 9, will be numbered 1 - 813, inclusive, and pupils in KS4, year groups 10 and 11, will be numbered 1 - 370, inclusive.
When reading through the height and weight columns on the database I realised some entries were wrong, or at least unconvincing, for example, a female pupil in year group 10 is being shown at 4.65m tall. As I think of height as feet and inches I will convert this below:
* 1 inch = 2.5cm
* 1 foot = 30cm
Therefore: 4.65m = 465cm
465/30
= 15.5 feet or 15 foot, 6 inches
5 foot 6 inches is far too tall for a girl of this age, or any other age, so I believe this data is wrong. Now I have noticed different pieces of incorrect data, these could have been from typing errors or maybe someone just not paying attention whilst inputting the data.
With the mistakes in mind I think it would be best if I took a random sample of pupils and exclude the rest from my investigation to try and avoid any of the mistakes getting into my investigation.
Other members of my class came to the same conclusion as me so we decided to save time we could choose the sample as a group.
We decided we would select, at random, 15 boys and 15 girls from each year group. The reason for choosing the number 15 is because it is one less than a multiple of four; this will therefore make it easier to find quartiles and medians during my investigation. I will also pick three extra pupils from each year group in case any of my original numbers were pupils with incorrect information.
As I mentioned before I have numbered each pupil, this is so I can easily select pupils at random for use in my investigation. I will be doing this by selecting the shift then random key on my scientific calculator and multiplying the generated number by 1000.
For example:
* Generated number = 0.002
* 0.0052 x 1000 = 2
This is a fair way of doing this as I have no control over the pupils chosen to use in my investigation.
I ignored any numbers generated by my calculator that were outside the ranges of numbers I needed.
I entered each number onto a form to keep a record of the numbers I had chosen at random. Our teacher put the information onto the college intranet in order for all students could access the data when needed.
To show my findings throughout the investigation I shall be using the computer to form scatter graphs, stem and leaf diagrams, tables and also box and whisker plots. I will also be using text to show my findings throughout as well as the above mentioned ways.
Now I have completed my plan I am able to test my chosen statement:
"The taller you are, the heavier you are."
I am now going to show a scatter graph to show evidence of height and weight from plotting every pupil I am using in my investigation.
The reason for using a scatter graph to show this is because this type of graph can show any correlation there may be from plotting the data.
To help show any possible correlation I shall also show a line of best fit in my graph.
I believe the scatter graph will show strong positive correlation as I think that generally, people who are taller weigh more. Also the line of best fit should slope upwards showing that as the weight increases so does the height.