I am now able to easily create graphs etc from this data to prove my hypothesis.
Hypothesis 1: The taller the person the heavier they are.
To prove this hypothesis I shall create a scatter graph and draw a line of best fit. I shall plot my graph by putting the height along the bottom of the graph and weight going up the graph.
We can see from graph one and graph two that there is a strong positive correlation between height and weight. This means that I have successfully proved my hypothesis correct as weight does increase as height increases.
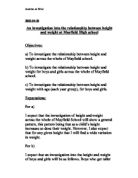
Hypothesis 2: Girls generally have a higher IQ than boys
For this I shall not be able to represent the data on a graph.
Instead I shall work out the mean for the IQ’s of both boys and girls and see which has the higher IQ.
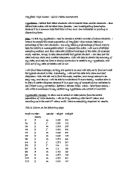
Boys: all the IQ’s added up
103+90+108+106+105+102+112+104+99+100+96+112+91+102+99
=1529
Then to find the average I need to divide 1529 by the number of male students.
1529/15 = 101.9 rounded up = 102
Average IQ for boys = 102
Girls: all the IQ’s added up
106+116+97+100+102+97+94+90+79+113+91+99+101+106+97
=1488
Then to find the average I need to divide 1488 by the number of female students.
1488/15 = 99.2 rounded up = 99
Average IQ for girls = 99
From doing this I have disproved my hypothesis and that actually males have the higher IQ. As this is only a sample I believe that there is a large degree of error as I may have a sample that only has females of a low IQ whereas the rest of the data may contain females with high IQ’s and vice versa for the males. Therefore I believe that this mean in inaccurate.
From this I can already see that the females have a greater range of IQ’s, starting way down at below 10IQ where the males does not start before 90IQ we could probably say that this was a mistake although we cant be sure.
From both my cumulative frequency graphs is clear to see that the females did generally have the lower IQ but the person with the overall highest IQ was a female and the person with the lowest IQ was also a female.
The median was also highest in the males and they had a more concentrated range of IQ’s. This too has disproved my hypothesis, as again it is clear that overall females have a lower
From the data I have analysed I found out about the relationship between height and weight of pupils but that the IQ information could only be used to tell people and show them but it would not be possible to work out anything of any importance from other than on average boys have a higher IQ than girls.
There is a possibility that it could be used to see whether certain people or a mass of people will get good grades at SAT’s or GCSE, because the IQ of a person is supposed to represent the intelligence of a person.
This is however could become inaccurate as a person could have a high IQ but still have other problems learning other things and so not do as well as predicted.
So overall this could possibly produce a rough guide as to how well someone will do in his or her exams
I could have used the information on the graph to see whether people are over or under the average weight. I would have to create separate graphs however for males and females as their weights vary in different ways so this could become difficult.