I don’t need to collect any data as I have been given it by my teacher but I will still have to choose my own sample of the pupils that I am actually going to use.
For the first part of my investigation, I am going to be using the year 10 students, girls and boys. In total there are 199 pupils in this year. I am going to use 66 pupils, which is a third of the total students in that year. But before I choose which pupils I am going to use I will have to take out any anomalous data this will ensure that my sample is fair. I will also choose my sample at random to ensure that nothing in the investigation is unbiased. I will get my random sample by pressing the random button on the calculator and then I will count that many pupils down the page. I am going to go through the data and delete any that have missing data or are impossible to be true.
To represent the first group of data, I will draw a scatter graph and I will then put in a line of best fit and explain what correlation there is to see if there is a connection between the two groups of results. For the second part of my investigation, I will do another scatter graph to show how I have interpreted my results.
Firstly I am going to remove any anomalous data so I know exactly how many students I have to take my sample from. After removing all of the anomalous data, I have established that there are 198 people in year 10. This means that I will be using a sample of 66 pupils. Next I have to find out which students I am going to use. To do this I will use the random control on the calculator. I have now got my sample.
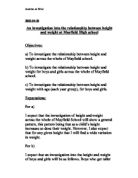
This graph shows that there is a strong correlation between the height and weight of the pupils I know this because as the height goes up the weight also goes up.
I am now going to try and find a correlation between the height and weight of the pupils in year 11. There are 170 pupils in year 11 once all of the anomalous data has been taken out. So for my sample, I will be using 56 of the pupils. To choose my sample I will again be using the random button on the calculator to make sure it is as unbiased as possible.
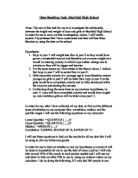
These results show that again as the height goes up the weight goes up which is as I predicted. On this graph most of the data is in the ‘bulk’, which is where the trend line passes through, but there are two pieces of data that are slightly to the left and these are either abnormalities in the results or the children simply don’t fit the regular pattern.
The two trend lines on the graphs are not as I thought they would be, the one for the year 11’s has a much steeper gradient than the one for the year 10’s which is far more level. Also in the year 10 graph the points are all in a cluster whereas in the year 11 one they start off in a cluster and then the points graduate up to higher up to the left of the trend line. Although on both of the graphs, the main cluster of the points is in between 1.5m and 2m on the x-axis.