James Black
Used Car Sales
Introduction
The aim of my investigation is to statically analyse a given set of data concerning used car sales and investigate the relationship that particular variables have with each other ones. These are the following variables: -
- The make of the car
- The model of the car
- The price when new
- The price when second hand
- The age of the car
- The colour of the car
- The car’s engine size
- The type of fuel the car takes.
- The MPG (miles per gallon) of the car
- If the car has been serviced
- The number of owners
To begin with I will investigate how the age of a vehicle affects the price when being resold and if this varies form make to make.
Prediction 1
From my experience with cars and gained knowledge, I am able to predict that as the age of a car increases the car depreciates and its value is lowered. Concerning the make and model of the car, the age and depreciation rate relationship will differ depending on what car is being looked at, for example a Ford Focus will depreciate at a slower rate than a Ford Escort because it is higher up in the range and more desirable to buyers.
Hypothesis 1
As a vehicle’s age increases the price of that vehicle will decrease.
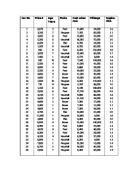
To aid me in my coursework I was presented with a table of 100 cars and their attributes e.g. colour, make, and age e.t.c. So that everyone’s coursework was different and to make it a little easier I decided to chooses 36 cars out of my given 100 to use as a sample for my study. I chose the number 36 firstly as it is divisible by 360 (number of degrees in a pie chart) and big enough to provide a wide range of contrasting results. I chose the cars by use of the random sample button on my calculator. After deleting any repeated results and continuing until I had 36 different cars I came up with the table shown below.

When this investigation has been completed I hope to understand a lot more about cars and how they are priced in terms of their characteristics and how mathematics can be applied to everyday situations such as the analysis of used cars.
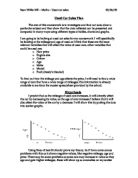
Initially, I will be comparing the prices of all thirty-six cars with their age. Generally as the age of a car increases it is likely to depreciate in value. Therefore age definitely has an affect on the price of the car.
...
This is a preview of the whole essay
When this investigation has been completed I hope to understand a lot more about cars and how they are priced in terms of their characteristics and how mathematics can be applied to everyday situations such as the analysis of used cars.
Initially, I will be comparing the prices of all thirty-six cars with their age. Generally as the age of a car increases it is likely to depreciate in value. Therefore age definitely has an affect on the price of the car.
As is visible on the graph as the age of a car increases the price decreases. These findings are in line with my prediction and back up my hypothesis. The graph also shows that a new car will depreciate at a faster rate than that of an older car. Therefore, the price depreciates slower as the age goes up. This graph is also correct in showing that no matter how old a car becomes it will never be worth a negative value.
So, a conclusion can be made from the graph, firstly
- As the age of a car increase the price decreases.
- No matter how old the car is its price will never become a negative value.
Prediction 2
Next I will compare the mileage against the current price of the car. Considering that a higher mileage means that the car has been used more, subsequently the parts will be older thus the car will have depreciated more as a result.
Hypothesis 2
I predict that a car with a higher mileage will be worth less than a car with a lower mileage.
The graph above shows similar results to that of the first graph in that as the mileage increase the price decreases. As shown by the negative correlation it is also apparent that that the price drops at a faster rate than when the car is younger than when it is older. Again it proves that the car will never reach a negative value in terms of price. The two points circled in red, are special cases because although both of their mileages are relatively low the point priced £2000 has a very high age and the other point circled red has a low age.
Again, from the graph we can come to a conclusion
- As the mileage of a car increases, the price decreases.
- Despite having a low mileage the age counts more towards a cars value because depreciation can occur even when the engine is switched off.
Having looked closely at the first two graphs I can conclude that age and mileage seem to be related because the graphs are very similar. Next, I will plot a graph showing the link between these two variables.
Prediction 3
I think that how closely the two variables mileage and age are linked depends on the amount of driving a person does a year. If the owner is older, than the car will have a lower mileage as opposed to a married couple with kids who will have a higher mileage. This data is not provided and so it is impossible to tell how closely or no age and mileage will be linked.
Hypothesis 3
Due to the likelihood of there being a variety of drivers I think there will be little correlation.
Not everybody travels the same distance in their car each year and these results showed this to be true. From the line of best fit I can see there seems to be little correlation between age and mileage due to the above fact.
The conclusion from this graph is as follows
- There is little correlation between a cars mileage and its age.
- If the results were averaged then the average miles per year travelled by each car would be 8355.7.
The next two variables I will be comparing are current price and engine size as I imagine there to be some sort of correlation. My thoughts come from the fact that bigger engines are more expensive to manufacture and therefore should make a car more expensive. Also through knowledge I have I know that faster cars are more expensive than slower ones and a bigger engine constitutes a faster car.
Prediction 4
Due to the reasons given above I think that a car with a bigger engine will cost more to buy second hand. I also must take into consideration the depreciation on the engines, which may make the results slightly hazy as even though a car began with a big engine the car may have depreciated over time and become slower thus becoming worth less.
Hypothesis 4
A car with a bigger engine will be worth more second hand than a car with a smaller engine.
The graph shows quite clearly that there is no correlation between the current price and engine size. Although the trend shows us that as the engine size of a car increase so does price the relationship is very weak. Even though there are many cars with the same engine size their prices are all very different. This could either be down to the make, condition, model, mileage or any one of the other factors.
From this graph I can conclude that
- The current price and engine size have little correlation if any.
As shown above there is little correlation between the current price of a car and its engine size. Due to the variety of ages throughout the data I have decided to investigate in the next graph the original price of a car with the engine size. From the next set of data I believe there to be a strong correlation between the two variables.
Prediction 5
When a car is put to sale straight from the showroom is price is determined by a number of variables. One of the leading determining factors is engine size, because quite obviously a bigger and more powerful engine is harder and more expensive to design and manufacture than a smaller and less powerful one. For this reason I think a car with a bigger engine initially will be worth more than a car with a smaller engine.
Hypothesis 5
The bigger the engine size, the more expensive that car will be from new.
As I predicted there is considerable correlation between the engine size and original price. In terms of vehicles the price in regards to make, colour and age in some cars e.t.c will usually depend on the fashion at the time. E.g. Skoda was regarded by many as a poor quality car company in the early nineties whereas now they are a fairly successful company sporting the same engines as Volkswagon. This is an example to show the changes that car companies can go through in terms of fashion. Dissimilarly the engine will always remain the same for example; a two litre engine made by the same company in a Skoda or a Bentley will always remain the same price providing they are the same engine. By this I can conclude that
- A larger engine size will result in a more expensive original price for a car.
- The original price of a car is more or less directly proportional to its engine size.
- For every increase of one litre to the car’s engine size the price increases £10790 in average.
Prediction 6
Based on what I have already discovered I think there should be some link between the original price of a car and the current price because if a car is sold originally at a high price should it not therefore remain at a higher price during it’s life than say a car that was sold for less originally. I say ‘think’ because although there should be in theory, I have to take into account the other variables which will almost certainly affect the price.
Hypothesis 6
The higher the original price in relation to another car the higher the current price will be in relation to that same car.
By looking at the graph, it is evident that the relationship between the original price and the current price is not very strong. The point circled in red indicates a car, which was originally very high in value but now has depreciated over 75% of its original value. This could be down to changing trends, age, condition, or mileage. From the graph the following conclusions can be made:
- Strong links do not occur between the current price and original price of a car although some forms of correlation can be made.
After having found a number of links between the variables of the cars that I was given I am now able to formulate an equation, which hopefully will enable me to further my investigation. From the data given I will attempt to see if there is a constant price decrease where,
Constant Price Decrease = Original Price – Current Price
The graph above shows little to no correlation at all between the current price and price decrease evident by the widespread range of points over the graph. As the price decrease is not constant because it varies depending on the age of the car it means that the age variable must be included which will leave us with price decrease per year.
Prediction 6
The next table and graph will show price decrease divided by the car’s age, as this will give me the amount of money each car depreciates per year. With this data I will be able to make assumptions that determine which make of car depreciates the fastest, as well as others. I think the results will show a stronger correlation than the last set because I have added a new variable, which I think, will give a clearer idea to which brand of car depreciates the fastest.
Hypothesis 6
I think there will be a strong correlation between the price decrease per year and the current price.
The results shown above still do not show a good correlation, which must indicate that there is a final variable that affects the price decrease per year. From process of elimination I can only conclude that this must be the make of the car since the rate of depreciation must vary from car to car for obvious reasons.
Prediction 7
As I was given data for ten or more car companies I have instead decided to examine data from only five car companies these being the ones that come up most in my random sample. The five I am researching are Fiat, Ford, Renault, Rover, and Vauxhall. From the next graph I intend to find out which car company produces the car’s which depreciate the fastest, which company depreciates the slowest, the cheapest and most expensive cars and for what reasons.
Hypothesis 7
From what I know already about cars and their attributes I predict that Ford will depreciate fastest as the cars they produce hold the highest retail value from new of the five car companies. Fiat, I Predict will depreciate slowest as that particular brand is renowned for producing low-tech economical and affordable cars thus making them cheap so they depreciate slower. Although these statements are true to the time now I am not sure of when the data I was given was produced, as the facts stated above may have not applied to the period at which my data was relevant.
From the graph above a number of conclusions can be drawn up. Firstly, it is evident that, as I predicted, Ford would be most expensive car manufacturer by the steeply sloping line of best fit. The steep line indicates that as soon as a Ford car is bought it depreciates very quickly and so the rate of depreciation per year also decreases but faster as a result than say, a Vauxhall car. Second to depreciate fastest were Vauxhall, then Renault and Rover being the slowest. Rover’s gently sloping line of best fit shows that the price of a Rover car goes down very slowly from when it is bought. (This is because Rover produces cars with low output engines mainly thus there is less to break down, maintain e.t.c. making them depreciate slower than other car manufacturers.) Because the car depreciates slowly the price decrease per year is also slowed. Although all of the above have positive lines of best fit, when we come to Fiat it looks as though the line is negative, which indicates that Fiat produce cars that increase in value over time which of course, is not true. The only suggestion that I can put forward is that I have not used a wide enough range of results or there was some sort of mistake while processing the data although I believe this not to be true as I double checked my workings.
From this study I have concluded a number of findings.
- As the age of a car increase the price decreases.
- No matter how old the car is its price will never become a negative value.
- As the mileage of a car increases, the price decreases.
- Despite having a low mileage the age counts more towards a cars value because depreciation can occur even when the engine is switched off.
- There is little correlation between a cars mileage and its age.
- If the results were averaged then the average miles per year travelled by each car produced by any manufacturer would be 8355.7.
- The current price and engine size have little correlation if any.
- A larger engine size will result in a more expensive original price for a car.
- The original price of a car is more or less directly proportional to its engine size on average.
- For every increase of one litre to the car’s engine size the price increases £10790 in average for all car manufacturers.
- Strong links do not occur between the current price and original price of a car although some forms of correlation can be made.
- The rate of depreciation is not constant, because it is affected by many other variables such as the age, mileage, original and current price as well as the engine size.
- The depreciation rate for a car indicates how much a car loses value (in %) since the previous year. This means the depreciation rate (in percentage changes every year getting smaller each year if all the other variables are either kept at at a constant or made into an average.
I have found this analysis very interesting and after looking and evaluating the evidence I have found the following:
- Car manufacturer Fiat uses many of the smaller engine sizes in their cars so that their cars are cheaper to run, more economical but slower as a result.
- Rover and Vauxhall hold their value the longest while producing relatively speedy and efficient cars.
- Ford produces cars that are expensive to purchase new and depreciate quickly but are fast, technically sound, and fairly efficient.
- Ford tends to have bigger engine outputs than the other car manufacturers.
- Fiat produces the cheapest cars when new due to their simple designs.