My first hypothesis is that I believe that boys are taller than girls. My justifi
I believe that boys are taller than girls
For me to prove this hypothesis right or wrong I have been given some data, which originates from Mayfield Secondary School. I have decided to choose this hypothesis because I am aware of the fact the data cannot be skewed because the school is open to all students and children are not selected on the basis of physical ability or intelligence.
order to pursue this hypothesis I first removed irrelevant columns of data so I could focus on the ones being discussed, while at the same time keeping any that may be useful for further break-downs of the data into age, gender, etc.
I then created a third sheet of data which combined the previously separate data for KS3 and KS4 in order to produce one set of data for the whole school that could be analysed as a whole.
In pursuance of my hypothesis, that boys are taller than girls, I then divided this data by gender so that boys and girls could be analysed separately, and their results compared.
I then sorted the two separate sets of data for boys and girls by height, so that I could identify, and decide how best to deal with, any rogue data at each end of the range. The following indiscrepancies in the data were removed:
Removed:
Height outside 2m, which I took as the maximum allowed height.
The modified data for boys and girls was then imported into Autograph to produce the following graphs for boys and girls across the whole school:
Height Distribution among girls.
Height Distribution among boys
[compare mean, median, mode etc here for the whole as well as differences in distribution, and draw conclusion accordingly]
I will now investigate this data further to determine if there is a correlation between the heights and weights, and if such a correlation occurs, whether it is stronger in boys or girls.
My first action with this data will be to remove any outliers from my data, eliminating any information which differs significantly from the majority at both ends of the range.
To do this, I will sort my data weight to easily identify such outliers.
The following records were removed:
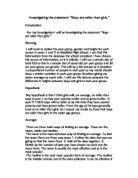
Weight significantly lower than next lowest, 25
Weight far above 93, the next largest record, While Massoma Abbas, this data was not present.
Even though for each of these records the data for height and weight may not both me anomalous, I have decided to remove the records completely if just one is anomalous. The reason for this is to ensure that the same number of samples for height and weight are used, and thus can be compared fairly and consistently.
With my modified data, I will now plot a scatter graph in order to identify any correlations or trends, and to determine the range and average values for my data. I will also construct a line of best fit, the gradient of which can be used to make predictions based on the overall trend using the correlation coefficient, which is the gradient of the line.
This graph shows a relatively clear positive correlation between Height and Weight. As height increases, generally, so does height, although at a moderate rate.
The equation of the line of best fit is:
y = 43.03x-18.47
This equation reveals a number of important facts about the correlation of my data:
The coefficient of x; the gradient of the line, shows that for every metre of height gained, statistically, height will increase by 43.03 kg.
I will apply this equation to the weight data, which will create an alternative set of heights. I will then compare these statistically calculated heights to the true heights in order to determine the reliability of the equation: