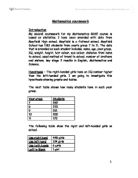
Upper Quartile: There are 60 data in total, to find the UQ, calculate 60x75% =45. Cross the y-axis from 45 till it meets the curve. When it meets the curve, vertical down till it meets the x-axis. Read the x-intercept and that’s the UQ.
Lower Quartile= 92 Upper Quartile= 105
Interquartile Range= 105 - 92=13
Median= 98
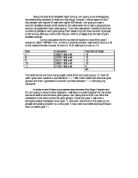
In the second graph, Cumulative Frequency Curve of the IQ of the Left-handed
I found the Lower Quartile
the Upper Quartile
the Interquartile Range
the Median of the left-handed
Lower Quartile = 100 Upper Quartile= 108
Interquartile Range= 108 - 100= 8
Median= 102
With these results, I can compare the median, upper quartile, lower quartile, maximum and minimum data of the left-handed and right-handed by Box and Whisker diagram
From the comparing of the Box and Whisker Diagram of the left-handed and the right-handed
We can comment:
- Both of them have a positive skew, but the left-handed have a have a higher positive skew than the right-handed. The skew of the right-handed is almost medium, but it is still a positive skew. The skew of the left-handed is showed clearly, we can classify it as a positive skew easily.
- From the left-handed and right-handed box and whisker diagram, both of them are positive skew, so they have higher mean than median
- The range and IQR of right-handed IQ is bigger than the left-handed IQ.
That shows the range of the left-handed IQ is much more concentrated and the data is not spread out widely.
- More than 75% of the left-handed IQ is higher than the median IQ of the right-handed.
Histogram is useful to see how the data is distributed, so I am going to draw histogram to show how data is spread.
First we have to draw another tables of the left-handed IQ and the right-handed IQ to calculate the frequency density. Then we can start to draw the two histograms. One for the left-handed and one for the right-handed.
Frequency Density= Frequency / Class interval
After looking into the histograms of the left-handed and the right-handed
I can comment:
- Both of the left-handed and the right-handed are concentrated in the IQ range 90-100 and 100-110
- The data in the left-handed is more concentrated in 100-100 then the right- handed , The Overall data for the right-handed is more spread out than the left-handed.
- The overall distribution after left-handed is more concentrated than the right-handed.
After looking into the histogram
We will try to investigate the data by mean and standard deviation. We can use the standard deviation to compare the range of the left-handed and the right-handed. See whether which is more spread out and compare the mean of the IQ of the left-handed and right-handed. Find out if the right-handed or left-handed has a higher average.
Formula to calculate the Mean
Formula for Mean:
∑ xn
n
Formula for Standard Deviation:
∑ represents the sum of a set of values
x represent the given data
_
x represent the mean
n is the number of value
First calculate the mean of the IQ of the right-handed
Mean:
∑ xn
n
Add all the numbers together, then divided by the n( that means the number of value)
∑ xn
n
= 5949
60
=99.15
The mean of the right-handed is 99.15
Standard deviation of the IQ of the right-handed
The x value in the formula
The x2 value in the data
In the formula of standard deviation
∑x2 = the sum of all the square of above data
= 595483
then in ∑x2
n
n= number of values =60
∴ ∑x2 = 595483 =9924.716667
n 60
The mean of the data that wasn’t squared
= 99.15
_ 2
so x =( 99.15 )2 = 9830.7225
in the formula
we can substitute all the data and find the S.D. of the IQ of the right-handed
_____________________
√9924.716667 - 9830.7225
_________
=√93.99416666
=9.6595058879
After calculating the Standard Deviation of the IQ of the right-handed
I will calculate the Mean and Standard Deviation of the IQ of the right-handed
IQ of the left-handed:
Mean: Add all the above data together and divided by the number of values
∑ xn
n
= 6249
60
=104.15
Then calculate the Standard Deviation
The x-values of the formula
Square all these data and find the x2 values in the formula
The data that were squared
Then add them all up to find the value ∑x2 in the formula
∑x2
= 663727
_
The x value means the mean of the data that wasn’t squared
Mean =104.15
_
(x)2
=(104.15) 2
=10847.2225
I have chosen 60 data only, so in this formula, the n (the number of values) will be 60
Substitute all the numbers I have got into the formula
∑x2
n
663727
= 60
=11062.1167
_
(x)2
=10847.2225
_
∑x2 - (x)2
n
= 11062.1167-10862.1167
=200
Square Root 200 to find the standard deviation
√200
=14.14213562
The standard deviation for IQ of the left-handed
In the comparing of the Standard Deviation, we can see the S.D. of the IQ of the Left-handed is obviously than the right-handed. The higher the standard deviation, that means the higher the data is spread. These results show the data of the left-handed spread wider than the right-handed since the S.D. of the left-handed is higher than the right-handed.
Then we compare the mean of the left-handed and the right-handed. The left-handed have a higher mean than the right-handed. I can conclude that the overall average of the IQ of the left-handed is higher than the right-handed. The IQ of the left-handed is 104.15 and the IQ of the right-handed is 99.15. The left-handed in average, have about 5 IQ higher than the right-handed. Only 60 data is collected, so I can say, the IQ that the left-handed are higher than the right-handed is 60 x 5=300 in the overall data, and in comparing the left-handed and the right-handed IQ individually, form the data, I can say each left-hand has 5 IQ higher than the right-handed, but we cant really say that since different people have different IQ, but that’s just a roughly calculation.
After that I compare the IQR and the S.D. since they are both calculating how the data spread out.
The IQR of the IQ right-handed is 62.5% higher than the IQ of the left-handed.
That means the data is more spread out in the right-handed
But the S.D. of the IQ of the left-handed is 46% higher than the right-handed.
It shows the data in the left-handed is more spread out.
In the S.D. and IQR, both of them have different conclusion. But the S.D. include all the small extreme data in it s even though I have excluded the main extreme data, so the range is smaller than the right-handed in the S.D., I think the IQR should be more trustable since it has excluded all the extreme data.
Final Conclusion
From the Box and Whisker diagram and calculating the IQR, I can conclude that the range of the IQ of the right-handed is spread wider than the left-handed, since it has a higher IQR. In the Box and Whisker diagram, both of them have a positive skew, that means the data the left-handed and the right-handed are having, are higher than the median. Also from the box and whisker diagram, it shows that more than 75% of the IQ of the left-handed is higher than the IQ of the right-handed median.
From comparing the histograms of the left-handed and right-handed, I can say most of the IQ of both left-handed and right-handed are concentrated between the range 100-120 and the data of the left-handed is even more concentrated than the right-handed between the range 100-110.
In the calculation of standard deviation and mean, I found out the mean of the left-handed is higher than the right-handed, it shows the average of the left-handed is higher. Overall it reflects the IQ of the left-handed is higher than the right-handed practically.
The reason that I didn’t compare the range of the standard deviation since it may contains some small extreme data, so the result was the left-handed data is more spread out than the right-handed.
Aim 2:
Is there a correlation between the IQ and the Key Stage 2 results for the left-handed and the right handed?
In the investigation of this aim, I am going to do 6 calculations
1) Correlation of the right-handed
-The English Key Stage results to the IQ
-The Maths Key Stage results to the IQ
-The Science Key Stage results to the IQ
2) Correlation of the right-handed
-The English Key Stage results to the IQ
-The Maths Key Stage results to the IQ
-The Science Key Stage results to the IQ
Then I will compare :
- Correlation of the English Key Stage results to the IQ of left-handed to right-handed
- Correlation of the Maths Key Stage results to the IQ of left-handed to right-handed
- Correlation of the Science Key Stage results to the IQ of left-handed to right-handed
I will calculate the correlation by using PMCC and scatter diagram
The answers for PMCC must lie between –1 to 1
-1 means high negative correlation
1 means high positive correlation
0 means there is no correlation
The closer the number to 0, the lower the correlation
Formula for PMCC
Σ x Σ y
r = Σxy - n _____________
√ 〔 Σ x² - ( Σ x )²〕〔 Σ y² - ( Σ y )²〕
n n
x represent the first kind of data (IQ)
y represent the second kind of data (KS2 results)
n represent the number of values
r is the PMCC
∑ represents the sum of a set of values
- Calculate PMCC of the right-handed IQ to the English Key Stage result
Substitute them into the formula
Σ x Σ y
r = Σxy - n _____________
√ 〔 Σ x² - ( Σ x )²〕〔 Σ y² - ( Σ y )²〕
n n
5949 x 246
r = 24383 - 60_____________
√ 〔 595483 - ( 5949)²〕〔 1056 - ( 248 )²〕
- 60
1463103.
r = 24383- 60_____________
√ 〔 595483 - 35390601〕〔 1056 - 61504〕
- 60
r= 24383 - 24385_______
√ 〔5639.65〕〔 30.93333334〕
r= -2___
417.6759191
r= -0.00479
After calculation, the PMCC for the right-handed IQ to the English Key Stage results is
–0.00479, which means it’s a negative low correlation.
To show how the data is distributed, we can draw a scatter diagram
In this diagram, it shows there isn’t any obvious correlation, and I plot the line of best fit for my data. From the line of best fit, I can calculate the equation for the line of best fit.
Pick two points from the line of best fit then find the slope of it
I picked (3,100) and (5, 99)
Slope:
100-99
8-3
=0.2
Extend the line of best fit to till it meets the y-intercept
Then read out the number, we can find the y-intercept
And the y-intercept is 99
So I can calculate the formula for the line
y=mx+c
y= -0.2(x) +99
From the line of best fit and the formula that I have just found out, I can even see how much each point is away from the y in the line of best fit.
In the bellowing box, real x means the x-coordinate that is plotted on the graph
Real y means the y means the y-coordinate that is plotted on the graph
The third column y= -0.2 x + 99, is the equation that I have found, which y equals the y-coordinate on the line of best fit and x equals to the x-coordinate of the line of best fit.
The forth column Real y- line y, then see the difference the y co-ordinate in the line of best fit and y-coordinate that I have plotted on the graph
So the total number that difference between the co-ordinate of the data and the co-ordinate of the line of best fit is 374.2
Now we investigate the correlation between the left-handed IQ and English KS2 result by the same method.
In the following table, which means x is the IQ, y is the KS2 English result of the left-handed
Formula for PMCC
Σ x Σ y
r = Σxy - n _____________
√ 〔 Σ x² - ( Σ x )²〕〔 Σ y² - ( Σ y )²〕
n n
Substitute all the numbers into the formula
(6249)(253)
r = 26395 - 60 _____________
√ 〔 653327 - ( 6249 )²〕〔 1127- ( 253 )²〕
- 60
r = 26395 - 26349.95_____________
√ 〔 653327 –650833.35〕〔 1127-1066.816667〕
r = 45.05_______________________
√〔2493.65〕〔 60.183333〕
r = 45.05_______________________
387.3966561
r=0.1163 (cor. to 4 d.p.)
The PMCC for the left-handed in IQ and English KS2 result is 0.1163. It’s a small positive correlation. It means there’s no big correlation between these two results. Next I am going to draw a scatter diagram to show the line of best fit, and show how the data are distributed.
Pick two points from the line of best fit, find the slope
(2, 101) and (5,103)
103-101
5-3
=0.67(cor. to 2 d.p.)
Extend the line of best fit and read out the y-intercept
y-intercept is 101
we have the y-intercept and the slope, so we can find the formula for the line of best fit.
y=mx+c
y=0.67x+101
Same as the one that we did before
Real x equals to the x co-ordinate of the data
Real y equals to the y co-ordinate of the data
y=0.67x+101 is the formula of the line of best fit
The difference between the co-ordinates of the data and the co-ordinate of the line of best fit is equal to Real y- line y
√y2 is not to let the difference have a negative number.
Then we calculate the total of it to see how much difference between the real x and the line x.
The total difference between the co-ordinate of the data and the co-ordinate of the line of best fit is 287.81
Comparing the PMCC and scatter diagram between the left-handed and right-handed in the correlation of IQ and Key Stage two results
The PMCC for the right-handed is -0.00479 and the PMCC for the left-handed is 0.1163. Both of them have a low correlation. Obviously, the left-handed have a higher low correlation between the English Key Stage result and the IQ.
After calculating the PMCC, we plotted the graph. In the graph, we can see that the data of the right-handed is more spread out than the left-handed, we can prove that by calculating the differences between the co-ordinates on the line of best fit and the co-ordinates on that was given.
So in conclusion, there’s no big relationship between the English Key Stage 2 results and the IQ.
Then we are going to investigate if there’s a correlation between the Maths Key Stage 2 results and the IQ.
Formula for PMCC
Σ x Σ y
r = Σxy - n _____________
√ 〔 Σ x² - ( Σ x )²〕〔 Σ y² - ( Σ y )²〕
n n
I will find the PMCC of the Maths KS2 result to IQ of the left-handed and right-handed, then compare them.
First I am going to draw a table for right-handed, let x be the Key Stage 2 result and y be the IQ of the right-handed
Substitute the collected data into the formula
Σ x Σ y
r = Σxy - n _____________
√ 〔 Σ x² - ( Σ x )²〕〔 Σ y² - ( Σ y )²〕
n n
251(5949)
r = 24924 - 60 _____________
√ 〔 1077 - ( 251 )²〕〔 595483 - ( 5949 )²〕
- 60
r = 37.35_____________
√ 〔 26.98333334〕〔5639.65〕
r = 37.35_____________
390.0981362
r = 0.0957( cor. to 4 d.p.)
The PMCC is 0.0957. It’s a low positive correlation.
Then I am going to plot a scatter diagram to draw the line of best fit and find the formula for it. Scatter Diagram can also show how the data is spread.
From the graph, we can see the data is widely spread, that’s why it’s a low positive correlation.
After drawing the line of best fit, I can calculate the equation for the line.
Pick two points from the line of best fit and calculate the slope of it
(3,100) (4, 103)
Slope:
103-100
4-3
=3
Extend the line of best fit till it meets the y-intercept
Then read out the number, we can find the y-intercept
And the y-intercept is 94
The formula of the line:
y=mx+c
y=3x+94
From the line of best fit and the formula that I have just found, I can calculate how far each point is away from the line of best fit.
So next, I am going to plot a table, then find the number of the total difference of all the points from the line of best fit.
In the following table, real x represents the x co-ordinate of the points that wasn’t on the line of best fit. Real y represents the y co-ordinate of the points that wasn’t on the line of best fit. With the help of the formula that we have found, we can calculate the answer.
So the total difference between the y co-ordinate of the data and the y co-ordinate of the line of best fit is 548.
Next I will calculate the PMCC of left-handed and then compare it with the right-handed
First draw a table
Substitute all these data into the formula
Σ x Σ y
r = Σxy - n _____________
√ 〔 Σ x² - ( Σ x )²〕〔 Σ y² - ( Σ y )²〕
n n
248(6249)
r = 25878 - 60_____________
√ 〔1056 - ( 248)²〕〔 653327- ( 6249 )²〕
- 60
r = 48.8__________________________
√ 〔 30.93333334〕[ 2493.65 ]
r = 48.8_____________
277.7353177
r= 0.1757 (cor. To 4 d.p.)
The PMCC is 0.1757. It’s a low positive correlation too.
Next, plot a scatter diagram to show how the data is spread and plot the line of best fit then find the equation for it.
Equation for the line of best fit
Pick two co-ordinates from the line of best fit and calculate the slope
(3, 101) (4, 103)
Slope:
103-101
4-3
=2
After the extension of line of best fit, the y-intercept is 99
Equation for the line of best fit
y=mx+c
y=2x+99
Plot another table to calculate the total number of the difference between the real
y co-ordinate and the y co-ordinate on the line of best fit
The total difference between the co-ordinate of the data and the co-ordinate of the line of best fit is 341.
Comparing:
Both of the PMCC of the left-handed and right-handed have a low positive correlation, but the left-handed have a higher correlation, that means the data is more concentrated and the data in the right-handed is more spread out than the left-handed.
From the difference of the line of best fit and the total data, we can it clearly that the data of the right-handed is more spread out than the left-handed.
From the graph, the data of the left-handed is widely spread out than the right-handed.
But also, because both of them don’t have a high correlation in the Maths KS2 results and the IQ, so IQ doesn’t really affect the Maths KS2 result.
Correlation between the IQ and the Science Key Stage Result of left-handed and right-handed
Because in this aim, I am just repeating the same method but I will use Science instead of Maths/English, so I won’t repeat myself again and not explaining the same thing again.
PMCC of left-handed
Σ x Σ y
r = Σxy - n _____________
√ 〔 Σ x² - ( Σ x )²〕〔 Σ y² - ( Σ y )²〕
n n
Substitute these data into the formula
Σ x Σ y
r = Σxy - n _____________
√ 〔 Σ x² - ( Σ x )²〕〔 Σ y² - ( Σ y )²〕
n n
r = 25726 - 25679.85_____________
√ 〔1149 - ( 259)²〕〔595483 - ( 5949 )²〕
- 60
r = 46.15_____________________________
√ 〔30.98333334〕〔5639.65〕
r=46.15
418.0133441
r=0.1104 (cor. to 4 sig. Fig.)
Scatter Diagram
Slope: (4.100) (5,103)
103 - 100
5-4
slope = 3
y-intercept=96
equation for the line of best fit
y=3x +96
There is a low positive correlation between the Science Key Stage 2 result and the IQ, but the data of the results are spread out widely, that means the low positive correlation is correct.
Calculate the PMCC for the left-handed
PMCC
Σ x Σ y
r = Σxy - n _____________
√ 〔 Σ x² - ( Σ x )²〕〔 Σ y² - ( Σ y )²〕
n n
r = 27192 - 27183.15_____________
√ 〔1161 - (261 )²〕〔 653327 - ( 6249 )²〕
- 60
r = 8.85____________ ________________
√ 〔 25.65〕〔2493.65〕
r= 8.85______
252.9073398
r=0.0350 (cor. To 4 d.p.)
This is a low positive correlation
Scatter Diagram
Slope: pick two points
(4,101)(5,102)
slope: 102-101
5-4
=1
y-intercept=101
Equation
y=1(x)+101
Both also have a low positive correlation, but the right-handed have a higher correlation. Although there the right-handed have a higher correlation than the left-handed, but the left-handed have a higher difference in the co-ordinates.
Final Conclusion for aim 2
After working out the PMCC, scatter diagram and find out the difference between the co-ordinates and the line of best fit. We found out there’s no correlation between the IQ and English Key Stage result; IQ and Maths Key Stage result and IQ and the Science Key Stage result. Even though they have a positive correlation, but it’s a low correlation, so it can’t proves anything that is important.
Aim 3)Red colour always gives people the feeling of aggressive. Creative people often have new ideas and are willing to try, so more left-handed people like “red” than right-handed
What I will do is collect 60 people who like red, and calculate the percentage of left-handed who like red and calculate the % of right-handed who like red.
After choosing the data randomly, we got 60 people who like red.
11 of them are left-handed
49 of them are right-handed
The percentage of left-handed in the overall people who like red is
11/60 x 100%=18%
The percentage of right-handed in the overall people who like red is
49/60 x 100% = 82%
After calculating these results, we can see that the % of left-handed who like red is only 18%, which is even less than a 50%, so not more left-handed people like red than the right-handed.
In order to give a more obvious answer, I will plot a Pie chart to show my answer more clearly.
Conclusion, the statement is incorrect because in this investigation, more right-handed like red more than left-handed.
Aim 4)The subjects “ Design & Technology”, “Art” and “Music” always require
creativity. More left-handed people like these subjects.
First find 20 people who study Design & Technology
20 people who study Art
20 people who study music
Then calculate the percentage of left-handed and right-handed.
Design of Technology:20 people: 12 left-handed =60%
8 right-handed=40%
Art: 20 people: 15 left-handed=75%
5 right-handed=25%
Music: 11 left-handed=55%
9 right-handed=45%
Then we will plot graphs to show the % of left-handed and right-handed
From the data, we can see more left-handed like these creative subjects than right-handed.
In follow up statement, I can say because these are the subjects which require creativity, and more left-handed people like these subjects, so they may be more creative.
Final Conclusion
My diagrams and calculations have helped me to show that:
Aim 1:
From the Box and Whisker diagram and calculating the IQR, I can conclude that the range of the IQ of the right-handed is spread wider than the left-handed, since it has a higher IQR. In the Box and Whisker diagram, both of them have a positive skew, that means the data the left-handed and the right-handed are having, are higher than the median. Also from the box and whisker diagram, it shows that more than 75% of the IQ of the left-handed is higher than the IQ of the right-handed median.
From comparing the histograms of the left-handed and right-handed, I can say most of the IQ of both left-handed and right-handed are concentrated between the range 100-120 and the data of the left-handed is even more concentrated than the right-handed between the range 100-110.
In the calculation of standard deviation and mean, I found out the mean of the left-handed is higher than the right-handed, it shows the average of the left-handed is higher. Overall it reflects the IQ of the left-handed is higher than the right-handed practically.
The reason that I didn’t compare the range of the standard deviation since it may contains some small extreme data, so the result was the left-handed data is more spread out than the right-handed.
Aim 2:
The Scatter Diagram helped us to show the correlation between the KS2 results and the IQ and it shows how the data distributed.
By calculating the PMCC, we can know the correlation, if it is high, low, positive or negative correlation.
Aim 3:
Calculating the % of left-handed and right-handed, we can have a general idea of if more left-handed people like red or if more right-handed people like red.
Pie Chart can show the data even more obviously and clearly.
Aim 4:
Also by using % and Pie chart, the data is clearly shown in a general idea.
This has showed my original statements to be correct/incorrect because:
Aim 1: The statement might be correct, because an important information that we collected was more than 75% of the left-handed have a higher IQ than the median of the right-handed. Overall the average of IQ of the left-handed is higher. And the range of the left-handed IQ is smaller because from lots of reliable graphs, the data is obvious.
Aim 2: From the scatter Diagram and the PMCC, we can say the second statement is incorrect, because when we calculate the PMCC, there’s only a very low positive correlation between the KS2 results and the IQ, so that means there isn’t a big correlation between the KS2 results and IQ. In the Scatter Diagram, we cant even see clearly what’s how the data is distributed, and I saw there’s no obvious correlation from the graph.
Aim 3: From the Pie chart and calculating the %, I can say the third statement is totally wrong, because the % of left-handed who like red is far away from the right-handed. So I think the graphs and calculation make the statement to be incorrect.
Aim 4: In the investigation of if those creative subjects, we can more left-handed like these subjects than the right-handed. We can see that obviously from the Pie chart, so the Statement is correct.
I am happy that my conclusions are reliable :
Most of the extreme data is removed and the calculation is repeated more than once to check whether the answer is correct. Except for that, the data is stratified before taken, so it reflects the real situation in more realistic way.