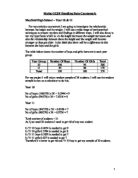
In Yr 10 girls 0.3784 is needed to get 8
In Yr 11 boys 0.1892 is needed to get 7
In Yr 11 girls 0.027 is needed to get 7
Therefore it’s better to get rid one Yr 10 boy to get my sample of 30 students.
My sample:
I am going to check if there are any outliers in this sample because outliers may change your whole result.
I am using standard deviation to check for anomalies.
A piece of data is considered an outlier if it is more than three standard deviations away from the mean of the data set.
The equation for standard deviation =
Where is the mean of the data set and n is the number of values.
For height
Mean = 1.66233
Standard Deviation = 0.085286
(2 x 0.085286) = 0.255858
1.66233 - 0.170572= 1.491758
1.66233 + 0.170572 = 18.98045
Therefore, anything less than 1.491758 and more than 1.832902 is considered as an outlier.
In my sample, there are no outliers
For weight
Mean = 55.93333
Standard Deviation = 9.490225
(2 x 9.490225) = 18.98045
55.93333 – 18.98045 = 36.95288
55.93333 + 18.98045 = 74.91378
So anything less than 36.95288 and more than 74.91378 is an outlier.
Hence, there is no outlier in my sample.
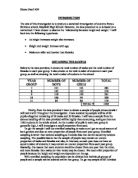
Tally chart for the height Tally chart for the weight
Height is a continuous data, so you Weight is also a continuous need to use class intervals. data; the class interval I’ve used
I’ve used a class interval of 0.05 m. is 5kg
The tally chart and the table of my sample are not very useful to compare my results. So you need to present them in different ways to compare the data.
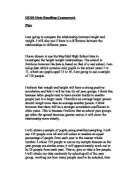
I’ve recorded my results on a histogram, which will be helpful to compare my results and test my hypotheses.
Histogram of heights
Histogram of weights
From my histograms and tally chart I found out that:
- Most students in year 10 and 11 are between 1.6-1.65 m.
- Just one student is shorter than 1.55m.
- Only a few students weigh less than 45kg and more than 65 kg.
- The average weight is 56 kg.
The sample I took was for both genders, I think there will be a difference if I take samples from both genders, and this also will help me to test my hypothesis:
The boys will grow taller than the girls and also they will weight more than the girls.
I will take a random sample of 30 girls and 30 boys from each year group.
Year 10:
No of boys: (106/190) x 30 = 16.737 ≈ 17
No of girls: (94/180) x 30 = 15.667 ≈ 16
Year 11
No of boys: (84/190) x 30 =13.263 ≈ 13
No of girls: (86/180) x 30 = 14.333 ≈ 14
Total no of boys = 17+13 = 30
Total no of girls = 16+14 = 30
Total no of students = 60
My new sample:
Check for an outlier
As I did for my first sample, I am going to do the same to check for the outlier.
The mean for the height of boys sample is:
(1.63+1.77+1.32+1.62+1.60+1.60+1.65+1.68+1.60+1.80+1.75+1.72+1.81+1.82+1.68+1.54+1.50+1.62+1.62+1.73+1.52+1.84+1.75+1.61+1.80+1.57+1.52+1.78+1.63+1.80)
30
Mean = 1.662667
Standard deviation = 0.11948
(2 x 0.11948) = 0.23896
1.662667 – 0.23896 = 1.429707
1.662667 + 0.23896 = 1.901627
Thus, anything less than 1.429707 and anything more than 1.901627 is an outlier.
In my sample there is only one outlier. I am going to leave this as it is because sometimes you might have someone shorter and he is not that short he is just approximately 0.10m shorter than the outlier range.
The mean for the weight of boys sample is:
(40+57+45+52+38+47+54+59+51+72+68+54+54+57+72+76+35+72+50+50+38+78+57+56+63+54+45+37+50+68)
30
Mean = 54.96667
Standard Deviation = 11.98126
(2 x 11.98126) = 23.96252
54.96667 – 23.96252 = 31.00415
54.96667 + 23.96252 = 78.92919
Anything less than 31.00415 and more than 78.92919 is an outlier.
There is no outlier
The mean for the
To compare my correlation I am going to use product momentum correlation coefficient. This is the accurate way to compare the correlation. It uses the mean of each set of data and looks at the distance away from the mean of each point.
The Formula is
Where and are the means of the x and y values respectively