Average Student
Introduction
The aim for this investigation is to find the average student in year 11. Using my knowledge and statistical skills I will be representing, interpreting and presenting data. I will be creating graphs and charts with my data, and then I will be using them to draw up conclusions.
For this investigation I have used secondary data and not primary data since it is less time consuming.
It is necessary to choose a random sample so that every student has an equal chance of being in the sample, and this must also be achieved without bias. This can be decided using a simple method because the secondary data is in alphabetical order. Therefore, names will have no value or bearing on any of the fields I will be using. So I have decided that I will be using 'systematic sampling'.
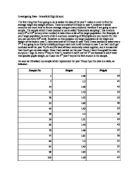
I have decided on 25 students for each gender, so I have chosen 25 boys and 25 girls which is 50 students altogether, I think that this is a reasonable sample size and it's not too much time consuming since the results will be meaningful.
The technique I used to choose my 50 students was to roll a dice and wait for a number between 1 and 4 to appear. I ignored numbers 5 and 6 since they will not be very time consuming.
Eventually, 4 was the number to appear on the dice. So I chose boy number 4 and girl number 4, and I went down the list of data choosing every 4th student.
Introduction
The aim for this investigation is to find the average student in year 11. Using my knowledge and statistical skills I will be representing, interpreting and presenting data. I will be creating graphs and charts with my data, and then I will be using them to draw up conclusions.
For this investigation I have used secondary data and not primary data since it is less time consuming.
It is necessary to choose a random sample so that every student has an equal chance of being in the sample, and this must also be achieved without bias. This can be decided using a simple method because the secondary data is in alphabetical order. Therefore, names will have no value or bearing on any of the fields I will be using. So I have decided that I will be using 'systematic sampling'.
I have decided on 25 students for each gender, so I have chosen 25 boys and 25 girls which is 50 students altogether, I think that this is a reasonable sample size and it's not too much time consuming since the results will be meaningful.
The technique I used to choose my 50 students was to roll a dice and wait for a number between 1 and 4 to appear. I ignored numbers 5 and 6 since they will not be very time consuming.
Eventually, 4 was the number to appear on the dice. So I chose boy number 4 and girl number 4, and I went down the list of data choosing every 4th student.