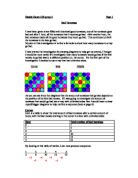
As you can see, the first tomato to go bad is the one coloured black. And then the tomatoes it touches go bad until all the tomatoes in the tray have gone bad.
Also it doesn’t matter which side the tomato starts going bad as long as it’s in the middle and on the side.
A table can be drawn from this for analysis and to generate a formula:
As you can see, the number gone bad are symmetrical. I worked out the total number gone bad using the ‘cumulative frequency method’-: 1; 1+3=4; 4+4=8; 8+4=12; 12+3=15; 15+1=16
A graph can be drawn for both the number gone bad and the total number gone bad:
As you can see from the graph, the relationship between x and z seems to resemble a cumulative frequency curve. This is interesting because the total number gone bad was calculated using the ‘cumulative frequency method’. But there is a relationship between x and y. This can be modelled by a quadratic equation since it is a quadratic curve:
The second position is any corner of the tray:
A table can be drawn from this for analysis and to generate a formula:
As you can see, the number gone bad are symmetrical. I worked out the total number gone bad using the ‘cumulative frequency method’-: 1; 1+2=3; 3+3=6; 6+4=10; 10+3=13; 13+2=15; 15+1=16
A graph can be drawn for both the number gone bad and the total number gone bad:
As you can see from the graph, the relationship between x and z seems to resemble a cumulative frequency curve. This is interesting because the total number gone bad was calculated using the ‘cumulative frequency method’. But there is a relationship between x and y. However, this is not a quadratic curve. There appears to be a linear relationship between x and y. But this linear relationship has 2 parts. So in effect there are two straight-line graphs. One is from 0 ≤ x ≤ 3 and the other is from 3 ≤ x ≤ 6.
So therefore there’ll be 2 equations – one for each part. These can be modelled by a linear equation since it is a linear graph:
The third and final position is anywhere in the middle:
A table can be drawn from this for analysis and to generate a formula:
As you can see, the number gone bad are symmetrical. I worked out the total number gone bad using the ‘cumulative frequency method’-: 1; 1+4=5; 5+6=11; 11+4=15; 15+1=16
A graph can be drawn for both the number gone bad and the total number gone bad: