******* *****
11R2
Data Handling Coursework
Mayfield Highschool
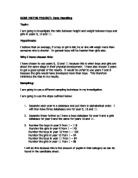
Introduction
The coursework I’m about to do is based on the height of pupils at Mayfield Highschool. I’m going to explore two hypotheses with secondary source data. My first hypothesis is that; boys are taller then girls, I am going to investigate this by looking at a stratified sample of boys and girls separately across years seven and eleven, and forming a cumulative frequency graph to compare the heights between them. My sample size is going to be 100. But before creating my sample I am going to remove any bias pieces of data that sets the rest of the population askew. I am then going to work out each strata size. The strata size is represented by proportion.
Example
Sample size 30
Once I have created my samples I am going to use a random number generator ‘RNG’ to select the data I’m going to use. I’m going to use a ‘RNG’ so that is a fair selection process opposed to counting them out, i.e. every 3rd person will be used. This method isn’t fair as the people after my sample size won’t be used. I.e. my sample size is 18 numbers 54 onward won’t be used.
My second hypothesis is that boys are always taller then girls. I shall explore this by creating separate box plots on each year.
Boys are Taller then Girls
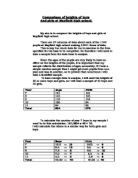
Before I create my samples I’m going to extract any bias pieces of information that may set my data askew. Here is just a few:
I’ve extracted this because the forename is missing.
I’ve extracted this one because her weight is out of proportion to her height. It’s a mis-print
Another mis-print no-body is 159m tall.
Weight is missing.
Mis-print
Mis-print
I’m going to create a sample out of all the data presented to me. (Years 7 – 11) I’m going to use approx a sample of 50 boys and 50 girls.
My Stratified Sample
Boys
Girls
Now I know my sample sizes I’m going to use the ‘RNG’ to select the data I’m going to use. Random numbers
Boys
Year 7