This shows us that the energy changes when mass increases. This affects the height as the mass increases. If the mass halves, the height doubles, which shows they are inversely proportional. In the “Mass Vs Height” graph, it should be a curve and in the “Mass Vs 1/height” graph, it should be nearly a straight line which goes through the origin.
Variable
The mass of adding on the bug up must be in a constant value. So for an example, if the mass of the bug up weights 10 grams, then for the next measurement you would add the same amount, so it is going to be 15 grams. In the experiment, I am going to use the mass as the independent variable and the height as the dependent variable.
Sankey Diagram
Method
First of all, I would use the same bug-up toy throughout the whole experiment, in order to have a fair test rather than changing to different toys from time to time. Basically what I need to do with the bug up is, I presses it down and forces the spring to jump up after a few seconds.
Next to the bug up, I would put a meter ruler standing up in a vertical position to record the readings of the height. I would record 3 sets of results on each jump, and then I will put one plastercine on each following jump and see how the height of bug up changes as the weight increases. On the opposite side of the ruler, I had set up a webcam on the clamp to capture the height and the readings.
I used a webcam because it is more precise to capture when the bug-up reaches its highest point. The webcam is connected with a software call Windows Movie Maker which had already been installed on the PC computer. After changing the settings of the webcam and finish setting up all the apparatus, I can now start with the first bug-up jump.
After recording the first set of three readings, I had added a one gram plastercine at the bottom of the bug-up and goes on to the next sets of jumps. I carried on this same procedure until the mass of the bug-up increases to twelve grams.
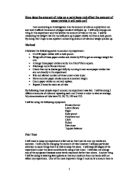
Predicted Graph
The height of the jump should be decreasing as the weight of the toy bug up increases. The masses of the bug should be inverse proportional to the height of how high it jumps. If the results of each jump are taken accurately and properly, the line on the graph should be a straight line.
Safety rules
- No throwing Bug up toy in the lab
- No throwing plastercine in the lab
- Avoid breaking the bug up toy
Preliminary work
After the preliminary work, I have found out that adding 1 gram of plastercine is quit suitable. It wasn’t too heavy, but it could show us that the height of the jump changes as the mass increases. I had measured the height with my naked eye before, and I think it wasn’t accurate enough so I am planning to use and record the jumps with a webcam which is connected to a computer. So I could double check the results and differences more accurate.
I have tried a lot of different ways to see which one is more suitable and more accurate to record the results and test the experiment. Before, I put add the plastercine on the top of the bug up as I increase the weight, but then I found out the plastercine increases the air resistance and makes the toy turns and spins as it jumps in mid air. As the bug up changes and spins in different direction, it would lose its energy and I would be not able to collect the accurate height. So now, I would put the plastercine underneath and inside the toy so it would jump more steadily.
Before I record one set of result for each jump, but then I found out it wasn’t that accurate so now I would record 3 sets of results and I can work out the average. Also, I will put labels on the ruler on every 10 cm so I can see the highest jump of the bug up more accurately and easily. If the jump was too low or high, which means my prediction is wrong and I would need to change the settings and experiment. Before I take the proper readings, I would give a few test runs on the bug up so I can be sure that the toy is working perfectly fine and properly.
The labels on the ruler can show the range of the measurements which then I can be for sure on the results. Although even I have set the apparatus and settings correctly in the real experiment, but I predict there will still be some mistake and natural errors. Sound and heat energy may get transferred from the kinetic energy when the spring compresses and when it jumps up.
Even I had added the plastercine underneath the bug up, but it would still have some air-resistance and it would still affect the jumping distance.
A small problem with the toy is that it won’t jump vertically all the time, so it would be hard to capture its highest jump point.
Another problem was, as the spring gets pushed down harder and faster, the spring would get damaged and it wouldn’t jump the best it can.
Obtaining results and evidences
I have done the bug up test and recorded the results. I had recorded 3 times for each jump and had worked out the average mean height so the results can be more accurate. I put the results into this table so it is easier to read and pot them on the charts. All the results are measures in millimeters and the mass in grams. I had double check with results and the mass, just to be sure that it is accurate and same.
Analyzing Data
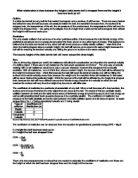
After plotting the results onto the graph, it clearly shows that as the mass increases, the height decreases. I am going to prove the mass of bug up in inversely proportional to the height. I am going to show this in a table of Mass against 1/ Height. The table is shown below. In the Mass against Height graph above, it clearly shows the height drops as the mass steadily increases. However, there are two outliers during the experiment, it had affected the results and changed the graph a little bit. Two outliners had pointed out in the graph above. It is obvious that they are not connecting with the line like the other results and which shows they might be not a fair test during that jump or an accident.
This graph of Mass Vs 1/average Height shows the relationship between them are inversely proportional because when I plot the results into the graph, they are in a straight line going up to the right. I have plotted in a line of best fit which can explain and be certain about this point. All the points are really close to the line of best fit and the line of best fit is a straight line and it had gone through the origin and connecting with most of the points.
Inversely Proportional
All the points plotted on the graph, they are very close and connected with the line of best fit. This shows they both have a very strong correlation between the mass of bug up and the height it jumps. If this proves correctly, which means my prediction for this experiment is correct or similar. Beginning with my prediction, I claimed that they both are inversely proportional to each other. I suggested and planned that if the result and the graphs are plotted correctly, I would have a straight line in the 1/Height graph and on the graph above, clearly show the points are connected to the line of best fit despite with two minor outliners. In which case, this proves my prediction is correct and the results has proves my prediction.
Gravitational Potential Energy
Gravitational Potential Energy is the potential energy that an object which possessed by anything which can fall. In this experiment, I can use this formula to show the difference of GPE the bug up has as the mass increases. If I apply the formula correctly, it can show us the GPE changes when the mass goes up and the height decreases. I am going to calculate the GPE and plot them onto a graph.
Plotting the GPE results on to the graph, it shows they are very close to each other and their amount of GPE is the same in each jump.
The two graphs above, I have plotted the predicted result and the real result together. I want to show the difference between the predicted ones and the real ones. The two graphs have shown the curve of both results is in the same shape but not in the same area. This is because I had predicted the result and it was not the same as the real ones. Moreover, the curve of both lines has shown that the results are mostly correct and true.
Conclusion
After finishing the experiment, I have found out that as mass increases equally, the height would decrease in a pattern. So the statement, when mass doubles the height halves is true. For example from the results I put in the table, when the mass is 8.6 grams, the average height is 510mm and when the mass doubles to 17.6 grams the average height is 270mm.
Although, the results might not be completely the same because there might not be a fair test at the jump so it changes the result a bit. More or less, the results are very close to each other as all the graph and results shows. I have drawn a GPE graph and mention that all of the jumps would get have the same amount of GPE. In the graph of “Mass Vs Average Height”, are a curve and a line of best fit on the “Mass Vs 1/Average Height” and through the origin. The line of best fit had mostly connected with most of the points. But there were a few errors because it was either not a fair test during that jump or an accident which causes the graph to change a bit or the results around.
For example, the kinetic energy may a lose little bit in sound and heat energy. They occurred when the bug up is jumping and when it gets push and when the spring gets compress and extends. Air resistance may affect the bug up jumping because when it jumps, the bug up may turn and spin. This would affect the height and the result.
When the bug up jumps, it’s not certain that it would jump in a straight vertical line. It may not balance and spins which had made me harder to get the measurements. The spring would get damage and jump less effective after the first 30 jumps. The graphs and result had showed me the relationship between the mass and heights are inversely proportional and the GPE value is the same even when they have different mass.
Evaluation
The result which I produced and collected has proved my prediction and the investigation, all my results have supported with this evidence. I have done this experiment in a fair test because I have used the same apparatus (ruler, webcam, and bug-up). I have added the plastercine equally underneath the toy and I have used the same procedure at recording the result with the webcam and the computer.
I have always added with the same mass amount of plastercine. I think my results could be more reliable if I have more time for the experiment next time. Next time if I could have a chance of doing this investigation again, I would do a few more procedures which could show and capture the results more accurate and precise.
I would record 5 times next time, so I could find out a better precise average result. I would record the process when the bug up jumps in slow motion so it will be easier for collecting the data and double checking it. I would change the spring of the bug up after every 20 jumps so it will keep in its best condition and would not change and affects the results.
If I could have more time next time, I would investigate and calculate the relationship between the speed changes. I would use a stop watch and measure the time so I can calculate the speed differences.
I would use a high pixel camera which then I can record the speed and height changes when the bug up is spinning and investigate the relationship between mass and height when they gets affected by rotating and air resistance.