Obviously, taking the whole population in a newspaper would take an extremely long time. Therefore, I have taken samples to represent the population, but at the same time minimise bias. I took samples from 8 different pages in both papers, and to make sure that the pages I chose correctly represented the entire population, I looked at the proportion of pages belonging to each category, which were general news, business, sports and TV/entertainment, in the two papers. I thought it would be the best to use stratified sampling, as in a population with several sub-genres, stratified sampling is capable of taking into account the presence of variety by sampling evenly according to the ratio of each sub-type. So, to do this, I had to decide how many pages I was going to take from each of the papers and in each of the categories. I chose to exclude adverts and non-news material, like comments, obituaries, letters to the editor and debate, from the samples because I think that these sections have no reflection on the actual journalism of the newspapers as they tend to differ greatly from the rest of the paper. From the proportion of pages in each category, I decided to take 3 pages of news, 2 of sports, 2 of business and 1 TV/entertainment page from the Times, and from the Mirror, 2 news, 2 sports and 4 TV/entertainment pages. Interestingly, there was no section in the Mirror devoted to business news. I labelled each page and using a random number generator, I selected the pages to be sampled from.
For counting the length of the sentences, I used systematic sampling. Starting on the upper-most sentence in the page, I took sample from every 4th sentence. I took 80 sample sentences from the 8 selected pages, so 10 in each page. I used a similar technique for getting the lengths of the words, but I took 20 samples from each page of every 10th word.
For the text area to rest area ratio, I obtained the data from the same 8 pages I took the word and sentence samples from.
In the articles in both papers, I inevitably came across abbreviations, acronyms and numbers. I decided that in counting the sentence lengths, I should include them but ignore them when getting the word lengths, as their lengths are irrelevant to the style of journalism. I also opted to exclude headlines and captions underneath pictures as they are usually shortened and therefore are so-called ‘outliers’ as these are extremes compared to the rest of the population. I included preposition in both the word and the sentence lengths count because I felt that their use and frequency something that could be affected by the journalists.
Also, the systematic sampling I used is not totally unbiased as random sampling because often, I hit on extremes.
Hypothesis 1
- H(0) There will be no significant difference between the two papers in terms of word lengths.
H(1) Times will have longer sentence lengths and a wider spread of sentence lengths than the Mirror.
*Please note that all approximate difference in this paper are calculated to be 100{(1±T/M)+(1±M/T)}/2 rounded to the nearest 5% when T=figure for Times and M=figure for Mirror.
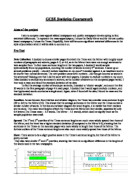
The reason why I drew a variable width histogram to compare the two statistics is that if I had drawn a box-and-a-whisker diagram, the outliers, in both papers, would have been excluded in both papers, but I want the outliers to be included because I think they do have some reflection on the style of journalism. Also, histograms show well the general distribution.
Interpretation of Results
Location: The top histogram shows the sentence lengths in the Times and the bottom one the Mirror. The mean sentence lengths in Times (26) is substantially higher than that of the Mirror (19), by nearly 8 words per sentence. When the means in both papers do not exceed even 30, this is quite something; 35% difference is significant, I would say.
Spread: The standard deviation for Times is 11, and for Mirror it is 9, again showing that Times has a wider spread, although this is only slight. The 20% difference in both standard deviation and IQR indicates a greater variety of journalism in the Times. Not only that, the Mirror has less sentences anyway so it would be harder to find sentences which would be considered as outliers in that they are longer than the ‘average’ sentence.
Skew: The sentence lengths in both papers seem to be positively skewed, though in the Times, it is very slight, co gay pared with the Mirror. Naturally, you would expect there to be positive skew. However, I do not think there is much to be commented on this.
For further investigation, I could to the normal distribution test, but I do not have to.
Conclusion: There was a quite significant difference in the sentence lengths. I reject H(0) in favour of H(1); the Times has quite significantly longer sentences than the Mirror. The fact that the Times has longer sentences could be due to a number of reasons. The Mirror is a shorter paper than the Times; so a way to deal with as many subjects and still keep ‘thin’ is to cut down on the provision of tiny details to the readers. In the Times, small details usually tend to be crammed in the same sentence after the main clause, effectively lengthening the sentences.
The Times did have slightly larger spread of sentence lengths, but not so much that I can say the difference was significant. However, the spread occurs at different levels; the median of the Times’ sentence lengths is 27, whereas in Mirror it was 19.
Hypothesis 2
- H(0) The two newspapers will have similar word lengths.
H(1) Times will have longer word lengths.
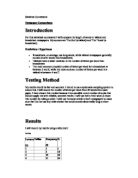
Diagram: I have chosen to use a box plot to compare the word lengths of the two papers because they show clearly the location, spread and skew of the data at one glance.
Location: The median in both cases lie on 4. The differences in the mean between the two papers is under 0.5 letters, with the Times being 4.7 and the Mirror 4.3, which is quite close, and renders itself insignificant.
Spread: The spread in the Times seems to be larger. Its IQ range is 4, whereas in the Mirror it is 2. You could comment that this does show a larger variety in the vocabulary used in the Times, but it might just be that there happened to be less prepositions in the Times sample, and as the sample was taken systematically, this could may well be the case.
Skew: The results in both papers are positively skewed. However, one would naturally expect that because of the presence of prepositions and articles in the English language, which occur very frequently and usually are very short, often only one or two letters.
Further Investigation: Seeing that there was no significant difference in the world lengths of the two papers, I wondered if this is so in all English literatures. So, I did a test to see if this was the case. I took 20 words from two books aimed at different age groups. The sample was selected by choosing every 4th word from a random page. I chose a book that is read by 9~10 year olds and another which has is aimed at adults. I found that the results are much the same as the results for the two newspapers. They have the same median to start with; and they share the lower quartile. However, ‘The Glass Bead Game’ has a wider IQR, indicating that its spread in lengths of the words is bigger than that of the children’s book.
Conclusion: There is no significant difference. H(1) is rejected in favour of H(0). There was actually more difference in the pre-test samples. Maybe this indifference in word lengths is something that is present in all English prose, as the further test has shown. It seems that there is not much to say about the comparison between the two papers in terms of word lengths. The actual word lengths are so similar that I cannot conclude much from them; their median was the same, for example. Although the IQR in the Times was bigger than that of the Mirror by 2, I think that was just ‘unlucky’; with the IQR being so small and the figures heavily clustered around the median, it could just be by chance that the there happened to be one or two less 2- or 3-lettered words.
Hypothesis 3
- H(0) There will be no significant difference in the text area to rest area ratio in the pages of the two newspapers.
H(1) There will be a significant difference in the text area to rest area ratio in the pages of the two papers.
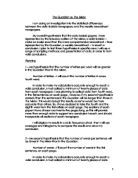
Diagram: I have drawn two scatter diagrams, with the y-axis being the percentage of the non-text area in the pages and the x-axis the percentage of text area in the corresponding pages. This means that the sum of the x co-ordinate and the y co-ordinate of a point always adds up to 100. So, all the points in the scatter diagrams lie on a straight diagonal line between (0,100) and (100,0) on the graph. However, it is not the gradient that matters in these two diagrams, as they both have the same; it is the location, spread and skew of the co-ordinates, which will give us information about the trend in the text area to rest area in the newspapers.
The sample size is not too big, as I only took the data from 8 pages. Still, I hope that what little sample I have would show some significant differences.
Interpretation of the Results
Location: You can see at a glance that the co-ordinates in the Mirror are grouped further up the y-axis than those of the Times. Clearly the Mirror has less text in its pages than the Times. Although it might appear that the difference in the mean is 20%, the real difference, when you ignore the fact that figures for the Times and the Mirror are in percents already and see the relationship between them in terms of the size of the actual figures, it is actually around 40%. If this is so with all other pages outside the 8 sample pages I chose, it suggests that the Mirror places greater emphasis on its big headlines and pictures and rely on them to attract readers, whereas in Times, the articles themselves have priority.
Spread: The co-ordinates for the Mirror are a little more clustered than those of the Times. This is because there are pages in the Times where a high percentage of the pages are occupied by pictures, but on the other hand have pages where there are hardly any pictures and have small headlines. For this, the Times had standard deviation of 11, whereas in the Mirror it was 9. However, it is not a very significant difference.
Further Investigation: As 8 pages is not considered to be a big enough a sample to be sure of the differences it indicates, I have prepared a frequency density histogram, with a much larger sample, to illustrate the text to rest ratio differences in the two papers. This indicates that not only are there more text in general in the Times pages, but also there is a bigger spread in the ratio.
Conclusion: There was a significant difference in the text area to the rest area in the two newspapers, with the Times having considerably more text in its pages than the Mirror. H(0) is rejected in favour of H(1). This strongly suggests that the Times concentrates more on the articles than the Mirror.
Hypothesis 4
- H(0) In corresponding articles written on the same subject and event, the article lengths in both papers will be the same
H(1) In corresponding articles written on the same subject and event, the articles in Times will be longer
I added this hypothesis to reinforce further the findings I made at hypothesis 3.
Data Collection: I was attempting to find a variable which could effectively compare the article lengths and support my prediction that the Times will have longer articles and there is in fact a general relationship between the article lengths
I had decided not to include the articles on the Rusedski drug scandal because not only has both papers written multiple articles on it, which makes it hard to compare, but also I felt that it was a big event that does not occur everyday so it was not really representative of any of the papers, and really rather a special feature of January 9th. I could only find 10 articles common to both papers and it is hoped that these will be sufficiently representative of the papers, and it may be that these articles are heavily distorted and not fit for comparison.
Diagram: I chose a scatter graph because this will show me if there is a correlation between the article lengths in the Times and the Mirror on the same subjects. It was hoped that I would find some sort of a trend line. If so, the gradient should reveal the relationship, which can be confirmed by looking at the correlation coefficient. Of course, if the articles I compared were not written on the same thing, I could have distorted the data however I liked.
Interpretation of Results: There is no doubt that there is a significant difference. This analysis has shown the highest percentage difference of anywhere in the project
Location: The mean article length for the Times is 715 words compared with the Mirror of 411. This is a 65% difference and is significant. This proves that the Times places a much greater emphasis on the text of the articles than the Mirror. This supports the last hypothesis that the two papers have different priorities.
Spread: A considerable difference exists between the spread in the lengths of the articles in the two papers; the Times has the standard deviation of 233, whereas the Mirror has 179. This tells us that in the Mirror, they like to keep the articles of similar lengths, all shorter than the Times, so that they are never long enough to overload the reader’s brain with information. However, in the Times, articles go on as long as it is felt is necessary to provide as much relevant information as readers would like to know. This significant difference of 25% suggests a more varying style of journalism in the Times than in the Mirror.
Further Investigation: The graph shows a positive relationship between the two, which is only normal as if something is ‘big’, newspapers tend to write longer on that subject. However, when I drew the y-on-x regression line, it came out to be y = 0.69x + 79.3. This, in short, proves that the articles in the Times are a lot longer than that of the Mirror. I can say that of the corresponding articles in the papers, those in the Mirror are in general only about 70% of the lengths of that in their Times’ counterpart. In fact, in no case y is greater than x. The fit is quite good too, the correlation coefficient is 0.893. The line of regression shows that there is something of a relationship between the two. Also, one would think that the newspapers would write mostly on the same events; but I only found 10 common articles to both papers. This also suggests that their articles deal in different subjects; maybe the material for the Mirror is not something that one can write a lot about.
Overall Summary
The reason as to why I chose the Times and the Mirror for comparison is that the Times is a stereo-type of quality papers and the Mirror represents the tabloids, so I can use these results to compare the broadsheets and tabloids in general. Although I obtained my data from the tabloid version of the Times, it still retains all its characteristics and all the articles are the same; it is only smaller.
I have already said that the Times has quite significantly longer sentences, but why would they want this to happen? Mirror is somewhat less ‘reputable’ than the Times, and is aimed at people who are not particularly interested in politics or business, but celebrity news and gossips, and for this purpose, the actual quality of the article does not matter; in fact, simpler articles are better because these people just want some basic information, which gets across the quickest to the reader’s mind in short, decisive sentences. However, Times targets people who want to read intelligent prose, with plenty of details and words to accurately describe and inform the situation to the readers.
Unfortunately, the second hypothesis turned out to be bit of a ‘dud’ and nothing much can be indicated in terms of word lengths.
However, I think that the third and the fourth hypotheses say more than the sentence lengths about the general editorial and the style of journalism in the two newspapers.
It is clear that there is less room for text in the Mirror, because so much is taken up by pictures. 17.5 is quite something, and as I have said before, that is not counting the headline areas. I have seen pages in the Mirror where the headlines occupy almost a half of the paper. Also, the picture to text area ratio in the Times is more consistent.
The articles in the Mirror are also shorter, as I have proved above, which is in accordance with the fact that there is less room for the text anyway. So why do people bother buying the Mirror then? The truth is, I must conclude, that the Mirror, as with all mass-appeal tabloids, sells itself by the pictures, ‘page 3 girls’ and catchy headlines. Therefore, not many people who read the Mirror care about its quality or the style of journalism, because more often than not, they will just skim over the text and look and the pictures. Also, the Mirror come up with many ridiculous stories and people are just interested in what happens because what happens is so outrageous. On the other hand, the readers of the Times want accurate information, and a lot of it.
People READ the Times and LOOK at the Mirror.