Hypothesis (1):
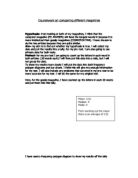
This is a copy of the questionnaire I have done and handed out to 32 students in year 10.
☺!Breanne’s Questionnaire!☺
-
What is your sex? (please tick 1 box)
Male Female
-
How old are you? (please tick 1 box)
14 15 16
-
Do you read or buy any of these magazines and if you don’t just tick other? (please tick 1 box)
J17 Max Power Other
-
What set are you in for the following subjects? (just put a number in the space)
Science _____ Maths _____ English _____
I would appreciate if you get these questionnaires back to me Breanne Loucks before the Easter holidays! Thank you very much for your time!☺
Now with my information that I have collected I can find out by using question 3 and if the person reads J17 then I should be able to relate that to question 4 whether they are in the top sets, and if I have found the person reads Max Power they are in the lower sets.
These are my results: I have decided to not use the option other because in this case I am not interested in what other magazines that people read I’m only interested in the results from the two magazines Max Power and J17.
Table for Maths results:
Key
- Represents which one I am talking about
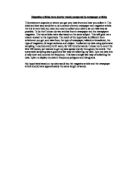
This is a graph of my MATHS results I have chosen to do a line graph so that I am able to put 2 sets of data on the one graph so that I can compare the data. Ignoring
A graph showing the amount of girls
and boys in each MATHS set
Boys =
Girls =
How
Many
Girls
Or
Boys
Are In
Each
Set.
Sets
Conclusion for MATHS graph:
The graph shows that my prediction was correct. I can see this because the girl line starts high and then is declining slowly and then rapidly, and the boys line goes up then down but starts low, so that tells me that there are more boys in set 4 than there is boys in set 1 and there is more girls in set 1 than there is girls in set 4. So this shows that girls that read J17 are more intelligent than boys that read Max Power.
Table for my SCIENCE results:
Key
- Represents which one I am talking about
This is a graph of my SCIENCE results I have chosen to do a line graph so that I am able to put 2 sets of data on the one graph so that I can compare the data.
A graph showing the amount of girls
and boys in each SCIENCE set
Boys =
Girls =
How
Many
Girls
Or
Boys
Are In
Each
Set.
Sets
Conclusion for SCIENCE graph:
The graph shows me that my prediction is right again. I can tell this because it shows yet again that the girls line starts high and then declines quite rapidly, and the boys line starts quite high but not higher than the girls line then goes down and then up and at the end of the line it is higher than the girls, so this shows that there are more girls in set 1 than there is girls in set 4 and it also shows that there are more boys in set 4 than there are in set 2.
Table for my ENGLISH results:
Key
- Represents which one I am talking about
This is a graph of my ENGLISH results I have chosen to do a line graph so that I am able to put 2 sets of data on the one graph so that I can compare the data.
A graph showing the amount of girls
and boys in each ENGLISH set
Boys =
Girls =
How
Many
Girls
Or
Boys
Are In
Each
Set.
Sets
Conclusion for ENGLISH graph:
The graph shows me that my prediction was right yet again. I can tell this because the girls line starts high again and then declines quite rapidly and then slowly and the boys line starts much lower than the girls line and then goes up a lot, then down and then rapidly climbs right up to 4 people in set 5, so this shows that there is much more girls in set 1 than there is girls in set 5. It also shows that there are much more boys in set 5 than there is boys in set 1.
Overall Conclusion for Hypothesis (1):
Hypothesis (1) has been proved correctly on every graph and I have proved the same thing that the girls that read J17 are more intelligent than the boys that read Max Power.
Hypothesis (2):
The readability grade of my 1st 100-word article in J17:
The number of whole sentences = 5
100 = x therefore 100 = 20 therefore x = 20
The number of whole sentences 5
The number of words with 3 or more syllables (omitting capitalized words like Geri Halliwell) = 9 therefore y = 9
Now x + y = z therefore 20 + 9 = 29 therefore z = 29
Now z multiplied by 0.3 (and that gives the grade equivalent)
Therefore 29 * 0.3 = 8.7
So the grade equivalent of this article from J17 = 8.7
The readability grade of my 2nd 100-word article from J17:
The number of whole sentences = 6
100 = x therefore 100 = 16.7 (to 3sf) therefore x = 16.7
The number of whole sentences 6
The number of words with 3 or more syllables (omitting capitalized words like Geri Halliwell) = 6 therefore y = 6
Now x + y = z therefore 16.7 + 6 = 22.7 therefore z = 22.7
Now z multiplied by 0.3 (and that gives the grade equivalent)
Therefore 22.7 * 0.3 =
So the grade equivalent of this article from J17 = 6.81
The readability grade of my 3rd 100-word article from J17:
The number of whole sentences = 4
100 = x therefore 100 = 25 therefore x = 25
The number of whole sentences 4
The number of words with 3 or more syllables (omitting capitalized words like Geri Halliwell) = 11 therefore y = 11
Now x + y = z therefore 25 + 11 = 36 therefore z = 36
Now z multiplied by 0.3 (and that gives the grade equivalent)
Therefore 36 * 0.3 = 10.8
So the grade equivalent of this article from J17 = 10.8
The readability grade of my 4th 100-word article from J17:
The number of whole sentences = 6
100 = x therefore 100 = 16.7 (to 3sf) therefore x = 16.7
The number of whole sentences 6
The number of words with 3 or more syllables (omitting capitalized words like Geri Halliwell) = 9 therefore y = 9
Now x + y = z therefore 16.7 + 9 = 325.7 therefore z = 25.7
Now z multiplied by 0.3 (and that gives the grade equivalent)
Therefore 25.7 * 0.3 = 7.71
So the grade equivalent of this article from J17 = 7.71
Now I am going to find the mean readability grade of J17.
8.7 + 6.81 +10.8 + 7.71 = 34.02
34.02 = 8.51 (to 3sf)
4
So the mean readability grade for J17 = 8.51 (to 3sf)
The readability grade of my 1st 100-word article from Max Power:
The number of whole sentences = 6
100 = x therefore 100 = 16.7 (to 3sf) therefore x = 16.7
The number of whole sentences 6
The number of words with 3 or more syllables (omitting capitalized words like LED) = 6
Therefore y = 6
Now x + y = z therefore 16.7 + 6 = 22.7 therefore z = 22.7
Now z multiplied by 0.3 (and that gives the grade equivalent)
Therefore 22.7 * 0.3 = 6.81
So the grade equivalent of an article from Max Power = 6.81
The readability grade of my 2nd 100-word article from Max Power:
The number of whole sentences = 4
100 = x therefore 100 = 25 therefore x = 25
The number of whole sentences 4
The number of words with 3 or more syllables (omitting capitalized words like LED) = 9
Therefore y = 9
Now x + y = z therefore 25 + 9 = 34 therefore z = 34
Now z multiplied by 0.3 (and that gives the grade equivalent)
Therefore 34 * 0.3 = 10.2
So the grade equivalent of an article from Max Power = 10.2
The readability grade of my 3rd 100-word article from Max Power:
The number of whole sentences = 8
100 = x therefore 100 = 12.5 therefore x = 12.5
The number of whole sentences 8
The number of words with 3 or more syllables (omitting capitalized words like Dimma UK) = 12 Therefore y = 12
Now x + y = z therefore 12.5 + 12 = 22.7 therefore z = 24.5
Now z multiplied by 0.3 (and that gives the grade equivalent)
Therefore 24.5 * 0.3 = 7.35
So the grade equivalent of an article from Max Power = 7.35
The readability grade of my 4th 100-word article from Max Power:
The number of whole sentences = 6
100 = x therefore 100 = 16.7 (to 3sf) therefore x = 16.7
The number of whole sentences 6
The number of words with 3 or more syllables (omitting capitalized words like LDE and Maxed Out) = 11 therefore y = 11
Now x + y = z therefore 16.7 + 11 = 27.7 therefore z = 27.7
Now z multiplied by 0.3 (and that gives the grade equivalent)
Therefore 27.7 * 0.3 = 8.31
So the grade equivalent of an article from Max Power = 8.31
Now I am going to find the mean readability grade of J17.
6.81 + 10.2 + 7.35 + 8.31 = 34.02
32.67 = 8.17 (to 3sf)
4
So the mean readability grade for Max Power = 8.17 (to 3sf)
I am now going to put the 4 samples from Max Power and from J17 into order and I am going to put them into two, separate box plots next to each other so that I can compare the averages easily.
Overall Conclusion of Hypothesis (2):
After doing that investigation I was quite stunned because my prediction wasn’t correct. What I have found from doing Hypothesis (2) is that the readability grade of J17 was higher than the readability grade of Max Power.
I was originally going to just do 1 sample from each magazine but I thought that if I had of done that my results wouldn’t have been as accurate as doing 4 samples from each magazine and then finding the average readability grade. But the results have proved me wrong.
Hypothesis (3)
I have now got my 400-word article from J17 and I am going to systematic random sample every 4th word and tally them off. Then I am going to find the standard deviation of the 400-words.
Mean frequency = 10 + 22 + 22 + 19 + 8 + 9 + 2 + 2 + 2 + 2 + 2 = 100 = 7.69 (to 3sf)
- 13
Mean frequency = Y
Total 100 Total 822.9309
822.9309 = 7.96 (to 3sf)
13
So the standard deviation of the 400-word article from J17 is: 7.96 (to 3sf)
I am now going to do a Histogram to show the data in a different way. This way will show more density rather than just numbers.
This Histogram shows the length of
some words
Frequency
Density
Length of words
I have now got my 400-word article from Max Power and I am going to systematic random sample every 4th word and tally them off. Then I am going to find the standard deviation of the 400-words.
Mean frequency = 10 + 22 + 22 + 19 + 8 + 9 + 2 + 2 + 2 + 2 + 2 = 100 = 7.69 (to 3sf)
13 13
Mean frequency = Y
Total 100 Total 934.9309
934.9309 = 8.48 (to 3sf)
13
So the standard deviation of the 400-word article from Max Power is: 8.48 (to 3sf)
I am now going to do a Histogram to show the data in a different way. This way will show more density rather than just numbers.
This Histogram shows the length of
some words
Frequency
Density
Length of words
Overall Conclusion for Hypothesis (3):
I have predicted correctly again the two averages were:
Max Power: 8.48 (to 3sf)
J17: 7.96 (3sf)
So this shows that the average word length for Max Power is longer than the average word length for J17.
Also as you can see in the two histograms they show a lot as well because I have grouped the data unequal, then a histogram can help that by showing more of the density of the word lengths. When the data is unequal then by doing a histogram it can make it much easier for you to compare your results by looking more at the area of the bars. So as you can see easily that the 1st histogram shows a bigger area on the first bar, than the 2nd histogram, but the 2nd histogram shows more of a consistent, larger, area than the 1st histogram.
Overall Conclusion
I was very pleased with all my results and it shows that I predicted correct in Hypothesis (1) and (3). So with all my results together now I can really see that Max Power is bought for one reason only and that reason being for the topless, “supermodels”. I still think that J17 is a gossip magazine, but, still, I think that it’s a good educational magazine. I also still think that Max Power has very good potential for being a good magazine, but I have now proved that boys, men by the magazine for the women and A BIT of the cars.
Evaluation
I think my investigations were very fair and I have used more investigations than I thought I would have done. I was constantly going back to my hypothesis and what I was going to do and I had to change a few things. Like in Hypothesis (2) I was just going to do 1 sample and I changed it to 4 samples for each magazine, this gave me a better and more accurate mean, but I still think that on the whole the investigation was fair.
I think the method I used was suitable for data handling because I used a lot of work that we have done in this Data Handling module. I think I could have used more Data Handling techniques; I could have probably done 3 box plots on Hypothesis (1) instead of 3 line graphs. I feel that this might have been the way to go about it because they were much more complicated techniques to use but they would’ve shown me a better picture of what was going on.
Every one of my measurements were correct and every one I did properly and I didn’t cheat by estimating when it came down to counting the 400 words.
I think if I had of done more samples I would have got better results but saying that when I did 4 samples in Hypothesis (2) I think 4 was enough for the investigation to be reliable.
If I had the chance to do my investigation again I would have used more data handling techniques that I have learnt in class. That would have given me far stronger and reliable results and I think my conclusion would have consisted of much more evidence.