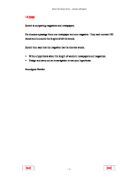
I have used a frequency polygon diagram to show my results off the tally.
I have counted up the words for the computer magazine and put it into this tally.
I have drawn a frequency polygon diagram to show my results off the tally.
From looking at both graphs, I can see that the gossip magazine has shorter words than the computer magazine. You can see this, because the average mean for the gossip magazine is 3.32 and the average mean for the computer magazine is 5.44.
I think should use more words because; I would get a large number of data, which give me an accurate reading. I also think I should group my data; this would be easier to read.
I have decided to do a bar graph for both my results of data, because it shows me the frequency of the number of words.
From looking at both graphs, they look very similar, but for the computer magazine you can see that frequency of the number of words are higher from 7-10.
I still need more information and data to be sure.
Here are the problems that I came across while doing my pre-test:
- Numbers between words.
-
Punctuation e.g. hair/skin/make-up ( punctuation)
- Brackets
- Symbols e.g. Microsoft
The following, is a list of the possible solutions that would solve my problem:
- Include them as a word E.g. make-up -- include as 2 words
- Do not include them at all
- Include each punctuation
as a word. E.g. make-up -- include as 3 words
If I do come across any problems above, for my real test, I will solve them by not including them at all. I now know that there will be no more problems that I will come across when counting up the letters in each word.
I am now going to do another test to get better results than my pre-test, and prove that my hypothesis is correct. I have used a larger number of data (number of words 100), and grouped my data to get a better average for both results.
Here is the data I have collected.
Here, I have used a cumulative frequency, I think this is a good way of showing my results, because I can find out the median, the lower and higher quartile and the inter quartile range.
Here are my results for my Computer magazine:
By using a cumulative frequency diagram I can now draw up a box plot, because it gives my enough information. It ties up any loose information neatly and it could all be into context. I decided to draw out my box plots on the same scale because I think it easier to analyse.
CONCLUSION
In conclusion I can say that my hypothesis was correct which is
‘I think that computer magazines have longer words than Gossip magazines.’ I know this because my results prove I am right.
For example:
My scatter graph for the gossip magazine’s shows that the …
Mean is 3.32
Median is 4
Mode is 4
But for the computer magazine, you can see had higher averages,
Mean is 5.44
Median is 5
Mode is 2 (not this average)
Another example, where the data shows similar results is the cumulative frequency. As you can see from both sets of averages, the higher averages are the computer magazines.
Computer mag:
Gossip mag:
The box plot data shows that computer magazine have longer words than the Gossip magazine, because the median on the box plot, for the computer magazine is bigger than the median for the Gossip magazine.
All my results on the diagram show that my hypothesis is correct.
I could improve my findings by having a bigger data for my sample. The limitations of my work is to
- Include more diagrams
- Have bigger diagrams to show my results more clearly.