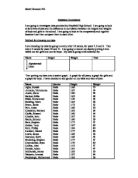
Finding the equations on my graphs
To find the equation for the line of best fit I know it will be in the form ‘y = mx + c’ m = gradient, c = y intercept.
All years
To find the equation for the line of best fit on any graph you need to find the gradient of the line and the y intercept. So you can substitute them into the equation for every line which is y = mx + c. So therefore I need to find them for my graphs.
I have been able to find the gradient on my graph and it is 40 so I can substitute this into my equation:
y = 40x + c
Now because my line doesn’t go through the y-axis we have to work out where about it would normally go so I need to substitute in 2 values off my graph. I have chosen them as:
x = 1.4
y = 42
So I need to replace x and y to find c:
42 = 40 x 1.4 + c
42 = 56 + c -56
-14 = c
So the equation is:
y = 40x + -14
To test this I need to test it on the graph and using the equation:
The graph
x = 1
y = 22
The equation
If x = 1
y = 40 x 1 + - 14
y = 40 + -14
y = 26
So this isn’t exact but it is very close.
All years (Girls)
To find the equation for this line of best fit I need to find the gradient so on the graph I have worked it out to be 20. So I can substitute this into the equation:
y = 20x + C
Also on my graph I can see that the y intercept is 16 so I will replace C in the equation for 16:
y = 20x + 16
I need to test this equation.
Test using graph:
If x = 0.5 then y = 26
Test using equation:
When x = 0.5
y = 20 x 0.5 + 16
y = 10 +16
y = 26
All years (Boys)
To find the equation for this line of best fit I need to find the gradient so on the graph I have worked it out to be 7. So I can substitute this into the equation:
y = 7x + c
Now because my line doesn’t go through the y-axis we have to work out where about it would normally go so I need to substitute in 2 values off my graph. I have chosen them as:
x = 1.7
y = 58
So I need to replace x and y to find c:
58 = 7 x 1.7 + C
58 = 11.9 + C -11.9
46.1 = C
So the equation is:
y = 7x + 46.1
To test this I need to test it on the graph and using the equation:
The Graph
x = 1.6
y = 52
The Equation
y = 7 x 1.6 + 46.1
y = 11.2 + 46.1
y = 57.3
So this isn’t exact but it is very close.
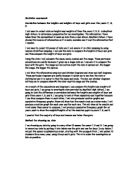
Conclusion
On average the graph shows that the taller boys are heavier than the taller girls, and on average I would say my graphs show the boys to be heavier. My graphs show that the correlation is positive and it is good.
Small boys are lighter in weight than small girls. Medium boys are heavier in weight than medium girls, ditto with tall boys and tall girls. So my original prediction is correct, the majority of boys are heavier than girls.