Correlation between the heights and weights of boys and girls over the years 7, 8, 9.
Statistics coursework
Correlation between the heights and weights of boys and girls over the years 7, 8, 9.
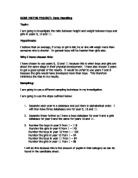
I will need to collect data on heights and weights of from the years 7, 8, 9, in Mayfield High School, to determine a population for my investigation. The information I have taken from the spreadsheet is made up data from a real school, Mayfield School. I have chosen this source of information as it is easily available and it was the information that I needed.
I will need to collect 30 pieces of data and I will ensure it is a fair sampling by using random stratified sampling. I will use the data to compare the heights of boys and girls and then compare the weight of boys and girls.
Using the data I will calculate the mean, mode, median and the range. These particular calculations are useful because it gives me a single data so I can use it to compare the boys with the girls. The range will tell me how much the data is spread out, the bigger the range, the bigger the spread.
I will show the information using box and whisker diagrams and stem and leaf diagrams. These particular diagrams are useful because it allows me to see how the data is distributed and it is easier to find the mean and mode. The box and whisker diagrams will help me to compare skews#, the inter-quartile range and the median.
As a result of the calculations and diagrams I can compare the heights and weights of boys and girls. I am going to investigate data provided by Mayfield High School. I am going to look the difference in correlation between the heights and weights of boys and girls from years 7, 8, and 9. I am going to look at them separately and together because I can then compare them to each other. I will also produced scatter graphs and cumulative frequency graphs, these will show how the results look on a wider scale. I will produce a scatter graph for each year and for each sex. This will show all he results and it will make them easier to compare. I will produce cumulative frequency graph for all years, each to show the weights/heights of all the selected pupils in years 7, 8, and 9.
I predict that the majority of boys are heavier and taller than girls.
Method for choosing my data
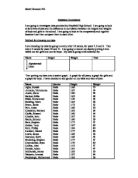
I am choosing my data by going to every other 10 names, for years 7, 8 and 9. I am going to record my data by putting it into tables one for girls and one for boys. In my tables I will put the names in alphabetical order, starting with the youngest first. I will picked 10 students from every year, using 5 boys and 5 girls. This is to make the investigation as fair as possible.
Year group
Surname
Forename
Forename 2
Age
Month
Month of birth
Gender
Height (m)
Weight (kg)
7
Ahmed
DJ
1
7
December
Male
62
48
7
Charleston
Kier
Nathan
2
2
May
Male
60
53
7
Coleman
Jenifer
Emma
2
0
October
Female
42
26
7
Cotton
Sammy
John
2
9
October
Male
71
49
7
Croft
James
2
8
November
Male
65
54
7
Glover
Danny
Melvyn
2
5
February
Male
52
45
7
Jones
Gemma
2
7
December
Female
53
46
7
Kelly
Jenifer
Fay
2
8
October
Female
31
28
7
Kenny
Jennifer
Fay
2
8
October
Female
64
53
7
Lloyd
Angelo
Louise
2
June
Female
48
43
8
Kid
Juge
3
9
October
Male
56
60
...
This is a preview of the whole essay
52
45
7
Jones
Gemma
2
7
December
Female
53
46
7
Kelly
Jenifer
Fay
2
8
October
Female
31
28
7
Kenny
Jennifer
Fay
2
8
October
Female
64
53
7
Lloyd
Angelo
Louise
2
June
Female
48
43
8
Kid
Juge
3
9
October
Male
56
60
8
Abbott
Zahara
3
2
May
Female
57
42
8
Dawson
Elliot
James
3
4
March
Male
69
59
8
Crawford
Kylie
Jane
3
8
November
Female
52
52
8
Bailey
Mellisa
3
June
Female
75
53
8
Bolton
Tracy
Katie
3
2
May
Female
63
48
8
Canan
Esther
3
June
Female
60
48
8
Long
John
Aaron
3
7
December
Male
65
54
8
Million
Arthur
3
8
November
Male
34
36
8
Moore
Robert
Lee
3
June
Male
32
35
9
Al-Jiboun
Tarah
4
2
May
Female
80
47
9
Asam
Muneer
4
5
February
Male
71
60
9
Bennett
Susan
Elizabeth
4
3
April
Female
60
40
9
Billard
Hailey
Billie
4
9
September
Female
63
42
9
Bowy
Jake
4
6
January
Male
54
53
9
Bravender
Andrew
Thomas
4
7
December
Male
62
52
9
Brown
Chantelle
Margaret
4
8
November
Female
80
48
9
Burns
Emma
Megan
4
3
April
Female
50
41
9
Butts
Simon
3
1
August
Male
54
42
9
Asam
Muneer
4
5
February
Male
71
51
Boys:
Year group
Surname
Forename
Forename2
Age
Month
Month of birth
Gender
Height (m)
Weight (kg)
7
Ahmed
DJ
1
7
December
Male
62
48
7
Charleston
Kier
Nathan
2
2
May
Male
60
53
7
Cotton
Sammy
John
2
9
October
Male
71
49
7
Croft
James
2
8
November
Male
65
54
7
Glover
Danny
Melvyn
2
5
February
Male
52
45
8
Kid
Juge
3
9
October
Male
56
60
8
Dawson
Elliot
James
3
4
March
Male
69
59
8
Long
John
Aaron
3
7
December
Male
65
54
8
Million
Arthur
3
8
November
Male
34
36
8
Moore
Robert
Lee
3
June
Male
32
35
9
Asam
Muneer
4
5
February
Male
71
60
9
Bowy
Jake
4
6
January
Male
54
53
9
Bravender
Andrew
Thomas
4
7
December
Male
62
52
9
Butts
Simon
3
1
August
Male
54
42
9
Asam
Muneer
4
5
February
Male
71
51
Girls:
Year group
Surname
Forename
Forename2
Age
Month
Month of birth
Gender
Height (m)
Weight (kg)
7
Coleman
Jenifer
Emma
2
0
October
Female
42
26
7
Jones
Gemma
2
7
December
Female
53
46
7
Kelly
Jenifer
Fay
2
8
October
Female
31
28
7
Kenny
Jennifer
Fay
2
8
October
Female
64
53
7
Lloyd
Angelo
Louise
2
June
Female
48
43
8
Abbott
Zahara
3
2
May
Female
57
42
8
Crawford
Kylie
Jane
3
8
November
Female
52
52
8
Bailey
Mellisa
3
June
Female
75
53
8
Bolton
Tracy
Katie
3
2
May
Female
63
48
8
Canan
Esther
3
June
Female
60
48
9
Al-Jiboun
Tarah
4
2
May
Female
80
47
9
Bennett
Susan
Elizabeth
4
3
April
Female
60
40
9
Billard
Hailey
Billie
4
9
September
Female
63
42
9
Brown
Chantelle
Margaret
4
8
November
Female
80
48
9
Burns
Emma
Megan
4
3
April
Female
50
41
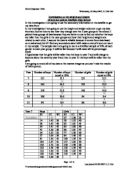
As a result of the calculations and diagrams I can compare the heights and weights of males and females.
To get a visual idea of the spread of my data, I have decided to represent it in a stem and leaf diagram:
Height
Males: 132-134-152-154-154-156-160-162-162-165-165-169-171-171-171
Cm
30
2, 4
40
50
2, 4, 4, 6
60
0, 2, 2, 5, 5, 9
70
, 1, 1
Females: 131-142-148-150-152-153-157-160-160-163-163-164-175-180-180
cm
30
40
2, 8
50
0, 2, 3, 7
60
0, 0, 3, 3, 4
70
5
80
0, 0
Mixed: 131-132-134-142-148-150-152-152-153-154-154-156-157-160-160-160-162-162-163-163-164-165-165-169-171-171-171-175-180-180
cm
30
, 2, 4
40
2, 8
50
0, 2, 2, 3, 4, 4, 6, 7
60
0, 0, 0, 2, 2, 3, 3, 4, 5, 5, 9
70
, 1, 1, 5
80
0, 0
As you can see from the above diagram:
The shortest person from all the years is 131cm and the tallest person is 180cm.
The shortest male is 132cm and the tallest is 171cm.
The shortest female is 131cm and the tallest is 170cm.
Most of the people in the years were between 150cm and 160cm in height.
Weight
Males: 35-36-42-45-48-49-51-52-53-53-54-54-59-60-60
kg
30
5, 6
40
2, 5, 8, 9
50
, 2, 3, 3, 4, 4, 9
60
0, 0
Females: 26-28-40-41-42-42-43-46-47-48-48-48-52-53-53
Kg
20
6, 8
30
40
0, 1, 2, 2, 3, 6, 7, 8, 8, 8
50
2, 3, 3
Mixed: 26-28-35-36-40-41-42-42-42-43-45-46-47-48-48-48-48-49-51-52-52-53-53-53-53-54-54-59-60-60
Kg
20
6, 8
30
5, 6
40
0, 1, 2, 2, 2, 3, 5, 6, 7, 8, 8, 8, 8, 9
50
, 2, 2, 3, 3, 3, 3, 4, 4, 9
60
0, 0
As you can see from the above diagram:
The lightest person from all the years is 26kg and the heaviest person is 60kg.
The lightest male is 35kg and the heaviest is 60kg.
The lightest female is 26kg and the heaviest is 52kg
Most of the people in the years were between 40kg and 50kg in weight.
From my stem and leaf diagrams it is now possible to calculate the mode, median, mean and the range.
Height
Males:
§ Mode - 171cm
§ Mean - 158.53cm
§ Median - 162cm
§ Range - 39cm
Females:
§ Mode - 160cm, 163cm, 180cm
§ Mean - 158.2cm
§ Median - 160cm
§ Range - 49cm
Mixed:
§ Mode - 160cm, 171cm
§ Mean - 158.53cm
§ Median - 160cm
§ Range - 49cm
Weight
Males:
§ Mode - 53kg, 54kg, 60kg
§ Mean - 50kg
§ Median -52 kg
§ Range - 25kg
Females:
§ Mode - 48kg
§ Mean - 43.8kg
§ Median - 46kg
§ Range - 27kg
Mixed:
§ Mode - 48kg, 53kg
§ Mean - 46.9kg
§ Median - 48kg
§ Range - 34kg
I have now decided to represent my data in box and whisker diagrams:
These diagrams are for males.
Height:
32 134 152 154 154 156 160 162 162 165 165
69 171 171 171
Smallest value = 132
Largest value = 162
Middle value = 162
32 134 152 154 154 156 160
4th value = 153 5th value 154
Lower quartile = 153 + 154 = 153.5
2
62 165 165 169 171 171 171
4th value = 167 5th value = 170
Upper quartile = 167 + 170 = 168.5
2
Positively skewed
130 135 140 145 150 155 160 165 170 175 180
LQ M UQ
Weight:
35 36 42 45 48 49 51 52 53 53 54 54
59 60 60
Smallest value = 35
Largest value = 60
Middle value = 52
35 36 42 45 48 49 51
4th value = 43.5 5th value = 46.5
Lower quartile = 43.5 + 46.5 = 45
2
53 53 54 54 59 60 60
4th value = 54 5th value = 56.5
Upper quartile = 54 + 56.5 = 55.25
2
Symmetrical
30 35 40 45 50 55 60
LQ M UQ
These diagrams are for females.
Height:
31 142 148 150 152 153 157 160 160 163 163 164
75 180 180
Smallest value = 131
Largest value = 180
Middle value = 160
31 142 148 150 152 153 157
4th value = 149 5th value = 151
Lower quartile = 149 + 151 = 150
2
60 163 163 164 175 180 180
4th value = 163.5 5th value = 169.5
Upper quartile = 163.5 + 169.5 = 166.5
2
Symmetrical
30 135 140 145 150 155 160 165 170 175 180
LQ M UQ
Weight:
26 28 40 41 42 42 43 46 47 48 48 48
52 53 53
Smallest value = 26
Largest Value = 53
Middle value = 46
26 28 40 41 42 42 43
4th value = 40.5 5th value = 41.5
Lower quartile = 40.5 + 41.5 = 41
2
47 48 48 48 52 53 53
4th value = 48 5th value = 50
Upper quartile = 48 + 50 = 49
2
Symmetrical
20 25 30 35 40 45 50 55
LQ M UQ
These box and whisker diagrams are for all years.
Height:
31 132 134 142 148 150 152 152 153 154 154 156
57 160 160 160 162 162 163 163 164 165 165 169
71 171 171 175 180 180
Smallest value = 131
Largest value = 180
Middle value = 160
31 132 134 142 148 150 152 152 153 154 154 156
57 160
6th value = 150 7th value = 152
Lower quartile = 150 + 152 = 151
2
62 162 163 163 164 165 165 169 171 171 171 175
80 180
6th Value = 165 7th Value = 165
Upper quartile = 165 + 165 = 165
2
Symmetrical
130 135 140 145 150 155 160 165 170 175 180
LQ M UQ
Weight:
26 28 35 36 40 41 42 42 42 43 45 46
47 48 48 48 48 49 51 52 52 53 53 53
53 54 54 59 60 60
Smallest value = 26
Largest value = 60
Middle value = 48
26 28 35 36 40 41 42 42 42 43 45 46
47 48
6th value = 41 7th value = 42
Lower quartile = 41 + 42 = 41.5
2
48 49 51 52 52 53 53 53 53 54 54 59
60 60
6TH value = 53 7th value = 53
Upper quartile = 53 + 53 = 53
2
Positively
20 25 30 35 40 45 50 55 60
LQ M UQ
Weight
The median weight for males is 50kg compared to the median weight of 43.8kg for females. This shows that, in general, the males generally weighed more than the females. The width of the box represents the inter-quartile range, a measure of variability of the data. The diagram above conveys to me that there is more variability in the males' data, this is because there is a wider box.
The box plot for the mixed weights is not symmetrical, the median is towards the left of the box and the whiskers are not of similar length. This shows that the distribution of values for the mixed weights is positively skewed. In comparison, the median for the males is in the centre of the box and the whiskers are an equal length. This indicates that the distribution of values for the males is symmetrical. The median for the females is towards the left-hand end of the box and the whisker to the right is considerably longer than the whisker to the left. This indicates that the distribution of values for the females is also positively skewed.
Height
The median height for males is 158.53cm, in comparison to the height of 158.2cm for the females. This shows that, in general, the males were generally taller than the females. The box for males is shorter and this shows to me that there is more variability between the females.
The box plots for the mixed heights are in the centre. This shows that the distribution of values for the mixed heights is symmetrical. The median for the males is also towards the right hand end of the box and the left is considerably long than the whisker to the left of the box. This indicates that the distribution of values for the male's heights is positively skewed. In comparison, the median for the females is in the centre of the box, the whisker to the left is the same length as the whisker to the right of the box. This indicates that the distribution of values for the female's heights is symmetrical.
I am now going to present my data in a several scatter diagrams:
Height (cm)
131-140
141-150
151-160
161-170
171-180
Frequency
3
3
10
8
6
Cumulative frequency
3 (AT 130.5)
6 (AT 140.5)
16 (AT 150.5)
24 (AT 160.5)
30 (AT 170.5)
Weight (kg)
21-30
31-40
41-50
51-60
Frequency
2
3
13
12
Cumulative Frequency
2 (AT 20.5)
5 (AT 30.5)
18 (AT 40.5)
40 (AT 50.5)
Analysis:
I began this investigation with the aim to find the average heights and weights of males and females in years 7, 8 and 9. From this investigation I found out that the average height for a student in year 7, 8, and 9 was 158.53 cm and the average weight for a student in year 7, 8, and 9 was 46.9kg.
I also found out that the average weight for females in years 7, 8, and 9 was 43.8kg, that the lightest female was 26kg and the heaviest was 53kg, giving a range of 27kg. In terms of height, the average height for females in year 7, 8, and, 9 was 158.2cm, the tallest female was 180cm and the shortest female was 131cm, giving a range of 49cm.
For the males the average weight was 50kg, the lightest male student was 35kg and the heaviest was 60cm, giving a range of 25kg. In terms of height, the average height for a male student was 158.53cm, the shortest male student was 131cm and the tallest was 171cm tall, giving a range of 39cm.
Conclusion
On average the graph shows that the taller boys are heavier than the taller girls, and on average I would say my graphs show the boys to be heavier. My graphs show that the correlation is positive but they are both weak. Small boys are lighter in weight than small girls. Medium boys are heavier in weight than medium girls, with tall boys and tall girls. So my original prediction is correct, the majority of boys are heavier than girls.