Data Collection
My data is secondary. I got it from a database of students at a school called Mayfield High.
Here is the data I am going to use:
I’ve taken 30 pupils data from a total of 170 pupils in Year 11. I picked them out at random to get a varied amount.
Now I’m going to do a tally of the pupil’s information. I’m going to do the boys and the girls separately and combined so I can use their individual data and combined data to make a variety of graphs.
I’m going to do the same for weight as well:
I am now going to do histograms for these tally charts. I think it is good to do a histogram because it makes it easy for me to compare results and see which is the highest. I can compare height and weight on several separate graphs.
Histograms displaying my data in several different ways:
From these graphs I can first see that the higher numbers and lower numbers tend to be more rare. There are very few people who are above 180cm.Most people seem to be around the middle of my graphs. I’m going to work out the average height and average weight later using a stem and leaf diagram. I can also see that generally boys tend to be slightly heavier than girls, because there are more heavy boys in the 70kg – 90kg than in the girls. The modal class interval for height is 160 < h < 170, and the modal class interval for weight is 50 < w < 55.
So far I think I can say that generally those who are taller tend to be heavier, because the graphs seem very similar in shape (small at lower end, high in middle, small at higher end).
I’m going to make a frequency polygon so I can compare girls and boy’s weights and heights on one graph. This will help me try to prove my hypothesis.
You can see from the height frequency polygon that the two different genders follow the same pattern as the histograms. The middle values are much higher than the low values and high values. This again shows that my hypothesis may be true. They are also very similar – girls seem to be a little shorter in some places than the boys.
I’m going to do a stem and leaf diagram. Stem and Leaf diagrams make it very easy to find out the mean, mode, range and median of my results because they are set out easily.
I’ve recorded the mean, modal class interval, range and median in a table.
The average height and average weight for boys is higher than the girls. The two modal class intervals between girls and boys are also similar. The middle height for boys is 172cm and for girls 167cm. This relates to my previous graphs where the middle values tend to be more common. The ranges for both girls and boys are very similar showing that both boys and girls data tends to be similar. I must remember that these results are only based on 30 students. If I did this for all 170 pupils the results may be quite different but could also be the same.
I want to compare weight and height on a graph together other than the frequency polygon. I’m going to do a scatter graph so I can look at the correlation of the sample.
Boys Results
Girls Results
The line of best fit is useful for helping me work out averages. For example, I can work out that someone who is 150 cms tall might weigh 50kg. Of course this is only an estimate.
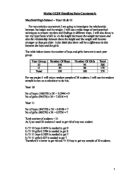
I’m going to make a cumulative frequency graph. Cumulative frequency graphs are good for display continuous data. The cumulative frequency is the running total of the frequency up to the end of the class interval. To find the cumulative frequency I first need to make a running total by adding the numbers.
From this I can work out which points I need to plot on my cumulative frequency graphs.
Weight: 45, 3 50, 6 55, 18 60, 19 65, 25 70, 27 80, 28 85, 30 90, 31 95, 32
Height: 140, 3 150, 5 160, 7 170, 19 180, 27 190, 31 200, 32 210, 35
Now I have finished all my graphs I think I can say that generally the taller someone is the more they weight. This is not always true as some people weight a lot but are quite short. However I think that my scatter graph especially shows a positive correlation, which tells me that my hypothesis was correct. My hypothesis was also that the Year 11’s would be more fully grown and I believe this is correct too.