The scatter diagram also shows that some pupil’s results are a long way from the line of best fit, this could be because I have used the whole school, therefore the results are very spread out, this could be why the line of best fit show that someone who is 0.6m tall would weigh around 0kg.
Hypothesis 2
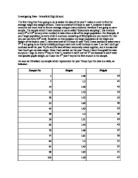
To test this second hypothesis, which is: is Height affected by age and gender; I will firstly need to collect a stratified sample of 30 pupils from years 7, 9 and 11. I have decided to use this sampling technique because each year has a different number of people in it so if I used just random sampling then because the majority of people are in the lower years then not many people who are in year 11 will be in the sample.
To collect this sample I will work out how many boys and girls I need from each year. To work this out I will divide the number of boys in that year by the total number in that year and then multiply it by 30. I will round the number to two significant numbers. I will do the same for girls.
E.g. Year 7 boys= 151/282*30= 16.06383=16
Now I have the number of students needed from each year I can do a random sample for that amount of pupils from each year and gender.
Here are the results:
First of all I am going present each of the groups on a stem and leaf diagram to show the most common heights for each age group.
The stem and leaf diagram shows that the most common height for year 7 is between 150cm and up to but not including 160cm. For year 9 it shows the most common height is between 150cm and up to but not including 170cm. For year 11 the most common height is between 160cm and up to but not including 170cm. This shows that the most common height group of year 11 is taller than year 7 and 9. Also the diagrams show that year 11 stem starts at a higher height than the other years, this shows that year 11 smallest pupil is taller than year 9 and 7 smallest pupil so this shows that yr11 are taller.
So, these diagrams show that Height is effected by age, and that the older you are the taller you are, but they do not show if height is affected by gender. To find out if Height is affected by gender I am going to firstly need to show the data of boys and girls on separate cumulative frequency diagrams.
The cumulative frequency curves above show that most girls’ heights tend to be lower than the boy’s heights. It also shows that the girls curve starts to go up more steeply after 150cm where as the boys starts to go up more steeply at about 160cm this shows that most boys heights are above a higher amount than the girls. I can use the cumulative frequency curves to work out how many percent of the boys in the school are over 1.6m and below 1.8m and how many percent of girls are in this range.
The cumulative frequency table tells me that there are 25 boys between 1.60m and 1.80m and there are 17 girls between 1.60m and 1.80m.
So this means that 25/90= 5/18 or 28% of the boys in the school will be between 1.60m and 1.80m and 17/90 or 19% of the girls in the school will be between 1.60m and 1.80m. This means that if I selected a boy at random from the school then there is a 0.28 chance of him been between 1.60m and 1.80m. Also because the percentage of girls in these ranges is lower than the boys it suggests that boys are in general taller than the girls.
The box plots show that the boy’s heights are a lot more spread out than the girls. They also show that the boys average height is outside of the interquartile range of the girls, this shows that over 75% of the girls in my sample are smaller than the boys average height.
I have come to the conclusion, that the evidence shows, that the older you are the taller you are likely to be and if you are male you are likely to be taller than a female. So the answer to the Hypothesis “Is height effected by age and gender” is yes it is.
Hypothesis 3
To test this hypothesis, which is, does body mass index change for different years and genders I will be using the stratified sample I used for my second hypothesis.
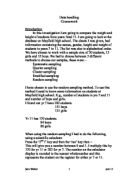
Body Mass Index (BMI) is your weight in kilograms divided by your height in meters squared: BMI=Kg/m2. Body Mass Index can be used to indicate if you are overweight, underweight or normal when. It can also show the average weight that other people of your Age, Height, Weight and Gender are.
First of all I am going to turn the results of the stratified sample into body mass index.
Now I am going to find out the Mean BMI for each year and gender.
The mean does not tell me much about the BMI for each year and gender so next I will put the sample of each year into a histogram to make the data easier to analyse.
The above Histogram shows that the BMI of year 7 and 9 are similar. Although year 7 have more pupils in the above 17 and below 21 data set and they have 2 pupils over 30kg/m2. The histogram also shows that the year 7 is more spread out.
This histogram shows that year 11 are a lot less spread out than year 9 and that year 9’s range is bigger.
This histogram show that Year 11’s Body mass index is a lot less spread out than Year 7.
All of the histograms show that each years Body Mass Index is different for example, year 7 have a very spread out Body Mass Index that is above the average, this suggests that year 7 are overweight for there height but this could be because they are just starting adolescence.
Now that I have found out that each year varies in how spread out the results are will use standard deviation to work how far from the average I have to go to find two thirds of the data for each year.
The results of the standard deviation calculations show that to get 2/3 of the data for year 7 I would have to go 4.06kg/m2 each side of the average of 20.27kg/m2. However for year 11 I would only have to go 2.32kg/m2 which is almost half as much. I think the reason for such a big difference between the standard deviation of each year is because like is said earlier year 7 are only just starting adolescence so they are putting on weight or they have started a growth spurt.
I think that the answer to the hypothesis, does body mass index change for different years is no because the averages of each year are not more than 0.6kg/m2 apart. However students in year 7 will have a lot more spread out Body Mass Index than students in Year 9 and 11.
Now I will look at the Body Mass Index of Males and Females in year 7, 9 and 11 to see what the differences are.
First of all I know from an earlier table that the average BMI of the year 7 males is 20.36 and the females is 20.17. So straight away I know there isn’t much difference between males and females in this year.
However the year 9 average BMI of the males is
17.63 and the females 21.19 so there is a lot bigger gap between the genders
Year 11 is also spread out more than year 7, the males have an average BMI of 20.47 and the females have an average of 18.98.
The box plots above show that the year 7 girls have the biggest range but their interquartile range is one of the smallest suggesting that the range has been influenced by one incorrect piece of data. Also the year 7 boys have a big range, again like the girls this could be influence by just one incorrect piece of data. The year 7 and 11 boys both have bigger averages than the girls suggesting that the boys in each year have a bigger body mass index. The year 9 boys average doesn’t fit in with the statement made above, I think that the stratified random sample picked people who where under average weight for their heights, so, that is why the girls average BMI in year 9 is higher. In year 11 the boys average is bigger than the whole sample of the year 11 girls, this suggests that older boys have a bigger body mass index than older girls. In year 9 I think the results collected by the secondary source where incorrect because, they don’t not fit the trend of the other results, which is the boys have higher averages and interquartile ranges than the girls in the same year.
The results to my further line of enquiry of how body mass index changes for Males and Females show that in general boys BMI is higher than the girls, and that the older you get the bigger the gap between the averages of males and females gets.
So the answer to the hypothesis is, the body mass index between each year varies, in the averages and the range. The BMI between each gender varies in averages and in ranges as well.
Summary
- There is a positive correlation between height and weight this means the taller you are the more you weigh. Also I have worked out an equation from which I can calculate an estimate of what you height should be based on your weight and vice versa.
- Height is affected by age and gender. The older you are the taller in general you are and males in general are taller than females. Also 28% of the boys in the school are between 1.6m and 1.8m. The male average height is more than 75% of the girl’s heights in my stratified random sample.
- Body mass index does not vary much between each year but the spread of the results is different for each year. Males BMI is bigger than females BMI in general.