COURSEWORK- MATHS DATA HANDLING
MAYFIELD HIGH SCHOOL
Mayfield High School is a fictitious high school. There are 1183 pupils in the database I have on the school. This data has come from the exam board, and so is made up. I am going to examine the many features of the data, and investigate the inter-effect they all have on each other.
The data base has 27 features for each pupil: Year group, surname, forename 1 and 2, age in years and months, month of birthday, gender, hair colour, eye colour, whether the person is left or right handed, favourite colour, favourite sport, favourite lesson, favourite TV program, Average number of hours TV watched per week, IQ, height, weight, distance travelled to school every day, type of transport to school number of siblings, number of pets, and Key Stage Three results in maths, science and English.
The data that I am most interested in examining is IQ. The IQ is an intelligence test, and I will be investigating how the IQ of a person relates to the other aspects of that person.
I will investigate these three hypotheses from the data I have:
. The lower the IQ of a person is, the more hours of TV that person will watch per week.
2. The older a person is, the higher that persons IQ is.
3. Males have higher IQs than females.
I will investigate this by using my data.
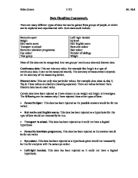
Before I start to investigate my data, I must choose how to analyse it. There are two forms of representing data- Firstly, a graphical representation of the data, (e.g. a scatter graph, frequency curve or box plot diagram) and secondly some numerical descriptive statistics (e.g. a measure of dispersion and a measure of central tendency). The ways to measure central tendency and dispersion are shown below: -
Measure of Central Tendency
Measure of Dispersion
Mean
Standard Deviation
Mode
Range
Median
Interquartile Range/ Quartile deviation
As indicated above, each measure of dispersion is associated with a corresponding measure of central tendency and is used at the same time as that measure of central tendency. All the different measures are used in different circumstances: -


