Data handling - Mayfield high school.
Year 11 Data handling coursework- Mayfield high school
Subject of the investigation
The purpose of this investigation of data handling is to investigate the rate of growth of males and females. The male sand females are pupils of the Mayfield high school in the North of England. I obtained the data from the Internet, of the pupils: Names, gender, year group, age, height, weight and I.Q. I sorted the data, to which I only needed the pupils year group, gender, height and weight. To investigate the data, I am going to need to create a random sample of pupils equally from year group and gender, down from 713 pupils because we only need years 7, 9, and 11, to just 300 pupils. The data is all set out in the form of a spreadsheet on the program Microsoft Excel.
Working out the amount needed for our random sample
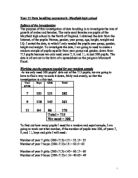
As we only need 300 pupils' data out of the 713 pupils, we are going to have to find a way to scale it down, fairly and evenly, so that the investigation is a fair test.
Year group
Boys
Girls
Total
7
51
31
282
9
18
43
261
1
84
86
70
Total = 713
We need = 300
To find out how many pupils I need for a random and equal sample, I am going to work out what number, if the number of pupils was 300, of years 7, 9, and 11, boys and girls I will need:
Number of year 7 girls: (300?713)?131= 55.12= 55
Number of year 7 boys: (300?713)?151= 63.5= 63
Number of year 9 girls: (300?713)?143= 60.17= 60
Number of year 9 boys: (300?713)?118= 49.65= 49
Number of year 11 girls: (300?713)?86= 36.19= 36
Number of year 11 boys: (300?713)?84= 35.34= 35
Creating the stratified sample
To make sure that the experiment is fair, and the outcome is very accurate results, we need to create a random sample of 300 pupils from the 713, equally from year group, gender height and weight. We worked out how many males and females from each year group we would need for the stratified sample, and now we have to get a fair sample from the amount we need. For us to be able to create the stratified sample, firstly we had to sort the original data from the 713 pupils. The original form of the data contained the pupil's names, year group, gender, height, weight and I.Q level. For this investigation, we only need year group; gender, height and weight, all the other columns of data can be deleted. Now we are left with year group, gender height and weight. For us to be able to easily create the stratified sample, we now have to sort the remaining data into year group (ascending) and males/ females. To do this, we highlighted the data, which is to be sorted, left clicked DATA and then SORT. A box now appears giving you the option of how the data is to be sorted and the column letter. For year group we chose: column A
Ascending order
OK.
The data is now sorted from year 7, to year 9, down to year 11 (respectively). Now for gender, we did the same but the data is sorted alphabetically, females then males.
To create a random number sample, for a stratified sample, we have to insert a new column for the random number left click INSERT, and COLUMN, there is now a blank new column. Then we have to create a random number for each row (pupil). In cell F3 (because of headings), type: =Rand (). Then we dragged it to ...
This is a preview of the whole essay
Ascending order
OK.
The data is now sorted from year 7, to year 9, down to year 11 (respectively). Now for gender, we did the same but the data is sorted alphabetically, females then males.
To create a random number sample, for a stratified sample, we have to insert a new column for the random number left click INSERT, and COLUMN, there is now a blank new column. Then we have to create a random number for each row (pupil). In cell F3 (because of headings), type: =Rand (). Then we dragged it to the bottom of the data so every row has a random number. To now sort the data into a random stratified sample we need to sort the random numbers and rows into a completely random order, you need to sort the random number column (because the numbers are random) into ascending order just like we sorted the year group.
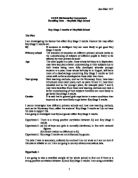
Now the data is still sorted into males and females in their individual year groups, but within them, a random order. This means that we can take the first amount of pupils needed for each group (year 7 girls, year 11 boy's etc), and obtain a still fair and random sample. The amount of the pupils to take is the part where I worked out the amount needed for the random sample (60 year 9 girls, 49 year 9 boy's etc.). One other thing we did to help us and make it easier to look at the data, is on the spreadsheets, add workbooks for each year group and one more for the stratified sample. In the screenshot below, you can see on the worksheet tab at the bottom: year 7, year 9, year 11, and sample, these are the four worksheets that we contained all the data within once sorted.
The hypotheses
The purpose of this investigation is to prove or disprove varied given hypotheses about pupil's heights, weights or body mass indexes. These are the hypotheses given, below:
. Males' weight will increase more during years 9 and 11 than it does in years 7 and 9.
* Females' weight will increase more during years 7 and 9 than it does in years 9 and 11.
2. Males' height increases throughout years 7, 9 and 11.
* Females' height increases throughout years 7, 9 and 11.
3. Body mass index will remain fixed throughout years 7, 9 and 11 because it is based on both height and weight.
4. Males will weigh more than females in each of years 7, 9 and 11.
5. Males will be taller than females in each of years 7, 9 and 11.
We have to choose one of the following combinations of hypotheses:
(a) 1, 3 and 4.
(b) 1, 3 and 5.
(c) 2, 3 and 4.
(c) 2, 3 and 5.
We also have a few means of method to follow depending on the hypotheses that we choose. These are:
* For hypotheses 1 and 2, use means to support your arguments.
* For hypothesis 3 use box and whisker plots.
* For hypotheses 4 and 5, use histograms.
The data
All of the data to me is secondary data because I was given it; I did not research it myself. Therefore, I do not know if the data is totally reliable because it is secondary. If I had found the data myself it would have been primary, thus I would know if it were reliable or not.
Dealing with problems
As people are not all around the same weight or height, there are going to be some out of proportion pieces of data (tall/short, heavy/light). I am going to ignore the ones, which are much larger/smaller than the rough average of each year group males and females. So as not to completely ignore these pieces of data, on my box and whisker plots, I will draw the lines on where the odd data would lie, and label them.
Chosen hypotheses
I have chosen to study the hypotheses set (c), which are hypotheses 2, 3 and 4. I have chosen this set because I think that it is the most varied, in that it contains a height hypothesis, a weight hypothesis and one about BMI (Body Mass Index). BMI is a ratio between height and weight, kg/m². The BMI for a "normal" adult lies between 18.5 and 25kg/m².
Hypothesis 2
For this hypothesis, this is what I have to prove or disprove:
* Males' height increases throughout years 7, 9 and 11.
* Females' height increases throughout years 7, 9 and 11.
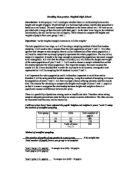
To prove or disprove this hypothesis, the method I am going to use is by getting the mean average of height for year 7 girls/boys, year 9 girls/boys and year 11 girls/boys and to produce regular line graphs.
Here is all of the mean's that I collected from the data:
Year group
Females
Males
7
.52
.60
9
.60
.70
1
.65
.74
Evaluation of height mean averages
For this hypothesis, I was trying to prove that boys and girls heights at the Mayfield high school increased through years 7, 9 and 11. To prove or disprove this, I calculated the mean averages of boys and girl's heights in years 7, 9 and 11.
From the mean averages, you can see that the boys and girl's height does increase as they got older, therefore the hypothesis is proved. Although you have to remember that not all girl's and boys height will have increased, because the mean is an average of the whole year.
From my own knowledge, I did know that people from birth up grow until about 25 years old, so in theory everyone's height should increase over that three-year period.
As you can see from the graph, it shows that there is a substantially greater increase from years 7 to 9, than 9 to 11 for both boys and the girls, this is possibly because growth rate is larger at a younger age.
I have proved this hypothesis (2), by using the mean average for the pupils' height. There were other methods I could of used such as using range or median averages, but the mean easily highlighted what I was trying to prove in the hypothesis.
There is only one problem with using the mean average for a large amount of data, and it is that some pupils who may be significantly different in height, would not show up on the graph, or people who may not have grown any more in three year period (possibly due to disability).
Hypothesis 3
Here is the hypothesis that I will be trying to prove or disprove:
* Body mass index will remain fixed throughout years 7, 9 and 11 because it is based on both height and weight.
For this hypothesis, I am going to calculate the median average from the body mass indexes, and create box and whisker plots.
Here is a table showing the maximum value, minimum value, and median's of the body mass indexes:
Year group
Gender
Max value
Min value
Median
7
F
52.1
4.7
33.4
M
27.2
7.8
7.1
9
F
52.9
2.8
32.9
M
36.3
0.2
22.9
1
F
42.4
2.9
27.7
M
37.5
6.5
9.9
To create the box and whisker plots, I also need to find the lower quartile and upper quartile ranges. For the lower quartile range, I divide the median by two. For the upper quartile range, I will have to divide the median by two and add half to the original.
Evaluation of BMI hypothesis
For this hypothesis, I had to proved that body mass index (BMI) would remain fixed throughout years 7, 9 and 11. To investigate this hypothesis, I used box and whisker plots, which require the median of the sets of values. As you can see form the plots, body mass index does not remain fixed through years 7, 9 and 11, because there is a significant difference in each of the plot diagrams. For the BMI to remain fixed, the box and whisker plots would all look the same.
There is also a significant difference in the range of the medians and maximum/ minimum values. As the plots show, the females have a significantly greater median (and UQ/LQ) plus the maximum/ minimum values. This is due to the fact that females are overall, more dense than males. Although there is not a huge difference in weight in a whole, males are generally, as proven in hypothesis 2, taller than females overall. This means that women are going to apply more pressure per m² than males whose weight is distributed more evenly due to them being generally taller. BMI is a measurement of pressure applied, in relation with height and weight. This is why the women overall have a greater BMI.
I have disproved this hypothesis because from the box and whisker plots, you can see a significant difference in the males and females, and even each year because eof constant and fast growth.
Hypothesis 4
Here is the hypothesis I will be trying to prove or disprove:
* Males will weigh more than females in each years of 7, 9 and 11.
For this hypothesis, I will use histograms to prove or disprove this theory.