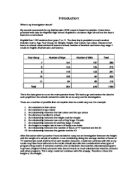
The total in the school is 1183 and there are 604 boys and 579 girls. To find a correct amount of boys and girls to take a sample of I have to find the ratio of how many girls to the total number of students there are and to multiply that number by 30 (sample size). In I will also do the same for the boys this will give me a fair number of how many boys and girls I will need to select which would consider the proportion of boys which is slightly higher than girls.
I will also need to consider the number of boys and girls to pick from each year. This is how I worked it out:
Year 7:
To determine how many boys and how many girls I will need to pick from year 7 I need to first find out how many boys and girls I need from year 7. To do this I will divide the total in year 7 by the total number of students.
- 282/1183 = 0.24
-
0.24 x 30 = 7.2 → 7 (nearest whole number)
From the total of 30 students 7 will come from year 7. The next step is to find out how many boys and how many girls I will pick from year 7. I divided 7 by the total number of boys and girls then I multiplied that figure by the number of boys then by the number of girls.
Number of boys:
-
(7/282) x 151 = 3.748 → 4 (nearest whole number)
This means that I will pick 4 boys from year 7. Again a slight degree of bias is introduced when I rounded up.
Number of girls:
-
(7/282) x 131 = 3.251 → 3 (nearest whole number)
This means that I will pick 3 girls from year 7. Rounding the number has introduced bias again.
Year 8:
I will use the same method that I used for year 7 to generate the numbers of boys and girls from year 8.
- 270/1183 = 0.23
-
0.23 x 30 = 6.9 → 7 (nearest whole number)
From year 8 I will also select 7 students.
Number of Boys:
-
(7/270) x 145 = 3.759 → 4 (nearest whole number)
Number of girls:
-
(7/270) x 125 = 3.241 → 3 (nearest whole number)
Year 9:
Total number of boys and girls from year 9:
- 261/1183 = 0.22
-
0.22 x 30 = 6.6 → 7 (nearest whole number)
Number of Boys:
-
(7/261) x 118 = 3.165 → 3 (nearest whole number)
Number of Girls:
-
(7/261) x 143 = 3.835 → 4 (nearest whole number)
Year 10:
Total number of boys and girls from year 10:
- 200/1183 = 0.17
-
0.17 x 30 = 5.1 → 5 (nearest whole number)
Number of Boys:
-
(5/200) x 106 = 2.65 → 3 (nearest whole number)
Number of Girls:
-
(5/200) x 94 = 2.35 → 2 (nearest whole number)
Year 11:
Total number of boys and girls from year 11:
- 170/1183 = 0.14
-
0.14 x 30 = 4.2 → 4 (nearest whole number)
Number of Boys:
-
(4/170) x 84 = 1.976 → 2 (nearest whole number)
Number of Girls:
-
(4/170) x 86 = 2.024 → 2 (nearest whole number)
Now that I know how many boys and how many girls I need from each year, I need to sort the data out so that I can easily source it all out. I firstly sorted the data into each year group. I then sorted out the genders. I took each set of data, e.g. boys in year 7, into a separate sheet and assign each a new number. I then needed to generate a random number to pick the specific students I was going to use in my sample. I did this for each year group.
There are two ways of selecting random students according to their special digit assigned to them. I could put all the boys (604) names into a hat and pick out 15 at random and record the names. However, in this case this is not appropriate as there is far too many people and the hat would have to be pretty big. Instead I will use my calculator using the random number button on the calculator.
How to use the random number button:
Press [shift] [ran#] on the calculator and it will display a random number between 0 and 1. You then multiply this number by the number of possibilities there are i.e. in my investigation the random number generated would be multiplied by the number of boys (604) and that will give me a number which is the number of the boy to be picked. In almost 99% of the cases the number will have to be rounded which will introduce bias into this investigation. I will do this fifteen times each time recording the number generated and if by any chance the calculator produces the same number I will simply have to ignore it and record another one.
E.g. In a lottery draw, the total number is 49.
Generate a number between 0 and 1 → 0.496
Multiply the number by 49 → 24.304
Gives 24.304 round the number → 24
24 is the number generated
These four simple steps are a much better and much more efficient way rather than choosing numbers / people from a hat. That is why I will use the random button on my calculator for this investigation quite often.
Picking the sample:
To pick the random students that I will use in my investigation I have decided to use the random number button on my calculator. First I will pick the required number of students from year 7.
Year 7:
From year 7 I will need to pick four boys and three girls. First the girls, I arranged them separately in a separate excel spread sheet.
Girls:
Each girl from year 7 was assigned a special ID number, in this case ranging from 1 to 131. I used the random button to generate thirty numbers.
- I used the following formula to generate the numbers (Ran#) x 131
There was some rounding involved which would have introduced some bias into my results also some numbers were repeated which meant that I had to ignore it and redo it.
I took those three numbers I generated and I looked through my year 7 girls’ sheet and I located the three and copied only the necessary information.
Boys:
I did the same for the boys as I had done to the girls. I first sorted the boys in year 7 in a separate spread sheet and assigned each boy with a special ID ranging from 1 to 151. I then used the random number button generate four ID’s and those will be the boys I select in my sample.
- This is the formula I used to generate the numbers below (Ran#) x 151
There was some rounding involved which would have introduced some bias into my results also some numbers were repeated which meant that I had to ignore it and redo it.
I then took these numbers and sourced out the students from my data.
I used the same method for each year right the way through from the remaining, Year 8 to Year 11 for both the girls and the boys.
Year 8:
From year 8 I need four boys and three girls.
Girls:
There was some rounding involved which would have introduced some bias into my results also some numbers were repeated which meant that I had to ignore it and redo it.
Boys:
There was some rounding involved which would have introduced some bias into my results also some numbers were repeated which meant that I had to ignore it and redo it.
Year 9:
From year 9 I need four girls and three boys.
Girls:
There was some rounding involved which would have introduced some bias into my results also some numbers were repeated which meant that I had to ignore it and redo it.
Boys:
There was some rounding involved which would have introduced some bias into my results also some numbers were repeated which meant that I had to ignore it and redo it.
Year 10:
From year 10 I will need two girls and three boys.
Girls:
There was some rounding involved which would have introduced some bias into my results also some numbers were repeated which meant that I had to ignore it and redo it.
Boys:
There was some rounding involved which would have introduced some bias into my results also some numbers were repeated which meant that I had to ignore it and redo it.
Year 11:
From year 11 I will pick two girls and two boys.
Girls:
There was some rounding involved which would have introduced some bias into my results also some numbers were repeated which meant that I had to ignore it and redo it.
Boys:
There was some rounding involved which would have introduced some bias into my results also some numbers were repeated which meant that I had to ignore it and redo it.
Now that I have picked out the 30 students who I will investigate, I will group them together and I will present them in a data capture sheet.
Skewness:
Skewness is a measure of the asymmetry of the data around the sample mean. If skewness is negative, the data are spread out more to the left of the mean than to the right. If skewness is positive, the data are spread out more to the right. The skewness of the normal distribution (or any perfectly symmetric distribution) is zero. In my investigation I will use the skewness to see the strength of the normal distribution.
Data I will use:
I now gathered all my results into one table which will make it easier to group. I assigned new id’s to each individual which would mean that if I ever need to refer to the student, writing his/her full name will take up unnecessary time. This new ID will make it easier to identify each individual.