Next I will use a list of all the names of the students in my college to execute my plan on. I will sort this list into the 5 year groups, yr7, yr8, yr9, yr10 and yr11. This makes sure that the information is not only form younger students but also older. I will have to now split the groups again, which leaves 10 people in each group. This could also be shown like this.
100 people
Boy and Girl groups
100 divided by 2 groups equals 50 people in each group
5 year groups
50 divided by 5 groups equals 10 people in each group
I will now give each group a number so it doesn’t get confusing.
Now I have to find a way of choosing the 10 people in each group. There will be about 150 people in each group and to choose the 10 people I will divide this number (whatever it may be) by 10 to get an X number and I will choose every Xth number from the list of people in each group. So if there were 150 people divided by 10 would be 15 then I would choose every 15th person on the list in each group.
The Questions
I will need to find out if girls and boys watch more of ITV1 of Channel 4. I will do this by asking the following questions.
- How many hours of ITV1 do you watch in a week?
- How many hours of Channel 4 do you watch in a week?
This will give me the information I need to continue with this project. I will gather the info by using e-mail to distribute the questionnaires to the randomly choose people. I am using e-mail as it is a quick and effective way of sending information and hopefully I will get the replies to the questionnaire quickly as well. This may not work though as sometimes people do not always go on their e-mail or they may have got banned or something. If the e-mail plan doesn’t work then I will have to result to notes in the tutor’s registers as then I can be sure that the questionnaires will reach the selected pupils. The problem with this tough is that the tutors may not take this seriously and just throw them in the bin. If I still haven’t got all the info by then, I will chase up the pupils and get the info straight away.
I have now collected all my information and will display it in these charts.
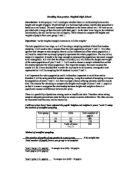
Now I have the info I will display them in a pie chart. I have chosen a pie chart because it shows the percentage of girls/boys who watch ITV1/C4 rather than a scatter diagram, as that would show how many hours boys/girls watch of ITV1/C4. The percentage is a better choice because the question I have been asked is for the ratio of male/female viewing time. These are the pie charts I have come up with.
ITV1
C4
Girls
Boys
Although in the first 2 pie charts it seems that the girls watch C4 more than ITV1 if you look at the 3rd pie chart this is obviously wrong. This is because girls just watch more hours of television than boys. The boys mean for watching T.V between both channels for a week is on average 6 hours and 30 minutes while the girls is 9 hours. This proves that girls watch more T.V than boys.
Conclusion
In conclusion I have found that girls watch more ITV1 than C4 so it would be a better idea for more advertising to be done on ITV1 than C4. If I were to do this study again then in my questionnaire I would ask the student for their most frequent watching hours. This would help, as the advertisers would know when to put the advertisement on at the right time on the right channel.