Data Handling Project for Mayfield School
I am going to be studying year 10 of Mayfield School. In this year group there are 100 girls and 100 boys, this makes the total 200.
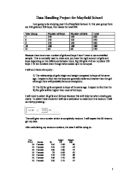
Because there is an even number of girls and boys I won’t have to use a stratified sample. This is normally used to make sure you have the right amount of girls and boys depending on the difference between them. Eg.140 girls =14 ran numbers 120 boys = 12 ran numbers even though when added up it is not equal.
I will do 2 lines of enquiry:-
1) The relationship of girls height and weight compared to boys of the same age. I expect to find that the boys are generally taller and heavier than the girl although there will probably be some exceptions.
2) The IQ for girls compared to boys of the same age. I expect to find that the IQ for girls will be higher than most of the boys.