
GCSE Maths Bad Tomato Investigation
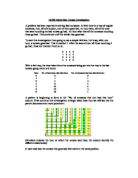
GCSE Maths Bad Tomato Investigation GCSE Maths Bad Tomato Investigation A problem has emerged involving bad tomatoes. I am going to investigate it and find some solutions to the problem. At first there is a regular tray of good tomatoes. Then suddenly, one goes bad. An hour later, all the ones that the bad tomato is touching go bad. This continues until the whole tray goes bad. The problem gets worse when the trays are stacked on top of each other, but I'll look at that later. I'm going to start by investigating a normal square box of tomatoes. It would look like this to start with: Then let's say tomato 1 goes bad: After one hour, tomatoes 1, 2 and 5 will be bad: Then after another hour tomatoes 3, 6 and 9 will go bad. This will continue until the whole tray of tomatoes is bad: After looking at this process, a pattern became obvious. This was that the quickest legal route to the furthest tomato away from the original bad tomato would be the number of hours for the whole tray to go bad. Basically, if tomato X goes bad, then the quickest legal route to tomato Y, being the furthest tomato away from tomato X would be the number of hours for the whole tray to go bad. Let's call this the XY rule. This 4 tomato by 4 tomato tray would take 6 hours to go bad: The order of tomatoes going bad is illustrated in this table: Hour (H) No. of bad toms after that hour

Bad Tomatoes Investigation
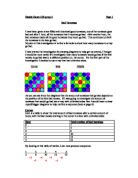
Identical good tomatoes are placed in a 4 by 4 tray: Each tomato is a circle. Each tomato just touches all the tomatoes next to it as shown in the diagram. The tomato highlighted goes bad. One hour later, all the tomatoes it touches go bad. After another hour, the bad tomatoes make all the good tomatoes they touch go bad. This continues until all the tomatoes in the tray go bad. The first part of this project is to investigate how tomatoes in the tray go bad. The second part of this project is to investigate how tomatoes in other trays go bad. Part 1 There are 3 different positions for the tomatoes to start going bad. The first position is anywhere in the middle of any side: As you can see, the first tomato to go bad is the one coloured black. And then the tomatoes it touches go bad until all the tomatoes in the tray have gone bad. Also it doesn't matter which side the tomato starts going bad as long as it's in the middle and on the side. A table can be drawn from this for analysis and to generate a formula: Number of hours ( ) 0 2 3 4 5 Number gone bad ( ) 3 4 4 3 Total number gone bad ( ) 4 8 2 5 6 As you can see, the number gone bad are symmetrical. I worked out the total number gone bad using the 'cumulative frequency method'-: 1; 1+3=4; 4+4=8;

Bad Tomatoes
Bad Tomatoes Bad Tomatoes Identical good tomatoes are placed in a box (see example). Each tomato is a sphere. Each tomato just touches all the other tomatoes next to it as shown in the diagram. Tomato five goes bad. This is counted as the first hour. One hour later, all the tomatoes it touches go bad (now tomatoes 5,1,6 and 9 are bad). This continues every hour untill all the tomatoes in the box are bad. I aim to investigate how tomatoes go bad in the above tray, and in trays of different sizes. How do tomatoes go bad in trays? In this investigation, I aim to find a formula for calculating the total time required for all tomatoes to go bad in a rectangular tray of any rectangular size, and with any bad tomato starting position. To achieve this, I will first need to explain with the use of diagrams, how I arrived at a formula for the total time required for the tray to go bad. This will be done in three stages, followed by a worked example, which will answer both part 1 of the investigation, and part 2. Part 3 is an extension of the investigation concerned with the average total time required a tray to go bad starting from one single tomato. The problem of calculation the total time required for all tomatoes to go bad is the same as the problem of calculating the time needed for bad tomatoes to reach the corner which is most remote from the starting position. If we can

Bad Tomatoes
Maths Coursework Investigation Bad Tomatoes My aim is to investigate the mathematical propagation of 'bad tomatoes' This is essentially an investigation of patterns derived from a simple set of rules for this propagation, in the manner of a simplified life genesis program. The rules are as followed: . The first hour, any one of the tomatoes (depending on the investigation) turns 'bad' 2. From that hour on, any tomato touched by a bad tomato will turn bad itself, on an hourly basis. 3. Tomatoes are constrained within an n*n grid, which restricts propagation of bad tomatoes. As visible from the rules, this allows for creation of simple models to show the propagation of bad tomatoes. From these, I hope to derive formulae, or sets of rules if formulae are not possible, to make logical predictions. We shall define the variables as will be used in the description of this investigation as follows: n The hour in which a tomato turns g The grid size (g2) x The number of turned tomatoes in each n h The number of hours taken for all tomatoes to go bad t Total number of turned tomatoes (equal to g2) Contents Item Page number Introduction Contents 2 Mapping of tomatoes in the middle of a side 3 Tomatoes in the corner 7 Conclusion 9 2 3 4 5 6 7 8 9 20 21 22 23 24 25 26 27 28 29 30 31 32 33 34 35 1 2 3 4 5 6 7 8 9 20 21 22 23

Bad Tomatoes Investigation
BAD TOMATOES In my experiment, I will investigate how the tomatoes turn bad and try to figure out a constant rule, for the time taken for boxes of tomatoes to go bad. Part 1 Here is the tray of 16 tomatoes; Next I am going to investigate with other sized boxes. E.g. 3*3 This box measures 2*2 This box measures 3*3 This box measures 5*5 This tray measures 6*6 My results have shown me that as the size of a tray of tomatoes increases, the time taken for a tray of tomatoes to turn bad also increases. I have also found that whatever a tray size may be, the maximum amount of tomatoes to turn bad in that particular tray, will always be the same as the size of the tray. Eg. A tray measuring 5*5 will have a maximum of 5 tomatoes, which turn bad. I have also found a formula, which tells me the time taken for all of the tomatoes to turn bad in any tray. However the rule will not work for trays below 4cm². The formula is 2n-3 in which the n stands for the size of a particular tray, eg. 5cm². The formula tells me the time taken for a whole tray to turn bad. I will prove this by using a tray, sized 10cm² as it is a tray, which I have not used and is not in keeping with the regular patern. Using my formula to calculate the time taken for the tray to turn bad, I predict that it will take 17 hours for a whole tray measuring 10*10 to turn bad. 2 * 10 - 3 = 17 Next I will
GCSE Maths Bad Tomato Investigation
GCSE Maths Bad Tomato Investigation A problem has been reported involving Bad tomatoes. At first there is a tray of regular tomatoes, then, all of a sudden, one of them goes bad. An hour later, all of the ones that were touching the bad tomato go bad. An hour after that all the tomatoes touching those go bad. This continues until the whole tray goes bad. To start this investigation I am going to use a simple 4x4 box. Let's say, after one hour, a tomato goes bad. This is marked 1. After the second hour all those touching it go bad, those are marked 2 and so on. 2 3 4 5 2 3 4 2 3 4 5 3 4 5 6 With a 4x4 tray, the time taken from the tomatoes being put into the tray to the last tomato going rotten is 6 hours. Hour No. of bad toms after that hour No. of tomatoes that turn bad that hour 0 0 0 2 4 3 3 8 4 4 2 4 5 5 3 6 6 A pattern is beginning to form in the "No. of tomatoes that turn bad that hour" column. If we continue this investigation to larger sized trays then we will see that the pattern becomes even more prominent. 2 3 4 5 6 7 8 9 0 1 2 3 4 5 6 7 8 9 0 2 3 4 5 6 7 8 9 0 1 3 4 5 6 7 8 9 0 1 2 4 5 6 7 8 9 0 1 2 3 5 6 7 8 9 0 1 2 3 4 6 7 8 9 0 1 2 3 4 5 7 8 9 0 1 2 3 4 5 6 8 9 0 1 2 3 4 5 6 7 9 0 1 2 3 4 5 6 7 8 (Numbers indicate the hour
Bad Tomatoes
Natalie Hayes 10E group 3 Page 1 Bad Tomatoes I have been given a box filled with identical good tomatoes, one of the tomatoes goes bad and after 1 hour, all the tomatoes that it touches go bad. After another hour, the bad tomatoes make all the good tomatoes they touch go bad. This continues until all the tomatoes in the box go bad. My aim in this investigation is to find a formula to show how many tomatoes in a tray go bad. I have started the investigation by drawing diagrams to help get me started, I thought it would be more useful if I investigated how many tomatoes would go bad if the first tomato to go bad was in a different position i.e. the corner. For the first part of the investigation I decided to use a tray that had unlimited sides. Corner Side Middle As you can see from the diagrams that the amount of tomatoes that go bad depends on the position of the first bad tomato. If I was going to investigate the amount of tomatoes that would go bad win a tray with unlimited sides then I would have to draw myself bigger diagrams to help me find a sequence (look at page 6) Corner Here is a table to show the total amount of bad tomatoes after a certain amount of hours, with the bad tomato starting in the corner in a
GCSE Mathematics - Bad tomatoes
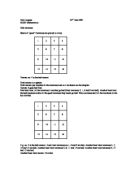
Dale Jacques 22nd June 2001 GCSE Mathematics Bad tomatoes Identical 'good' Tomatoes are placed in a tray. 1 2 3 4 5 6 7 8 9 10 11 12 13 14 15 16 Tomato no. 5 is the bad tomato Each tomato is a sphere. Each tomato just touches all the tomatoes next to it as shown on the diagram. Tomato 5 goes bad first. One hour later, all the tomatoes it touches go bad (Now tomatoes 5, 1, 6 and 9 are bad). Another hour later the bad tomatoes make all the good tomatoes they touch go bad. This continues until all the tomatoes in the box are bad. 1 2 3 4 5 6 7 8 9 10 11 12 13 14 15 16 E.g. no. 5 is the bad tomato 1-hour later tomatoes no.1, 6 and 9 are bad. Another hour later tomatoes 2, 7, 10 and 13 are bad. Another hour later tomatoes 3, 8, 11 and 14 are bad. Another hour later tomatoes 4, 12 and 15 are bad. Another hour later tomato 16 is bad. Hours No of bad tomatoes Bad tomato no. st hour 2 , 6, 9 2nd hour 4 2, 7, 10, 13 3rd hour 4 3, 8, 11, 14 4th hour 3 4, 12, 15 5th hour 6 What would happen if tomato no.1 was the bad tomato? 1 2 3 4 5 6 7 8 9 10 11 12 13 14 15 16 Hours No of bad tomatoes Bad tomato no. st hour 2 2, 5 2nd hour 3 3, 6, 9 3rd hour 4 4, 7, 10, 13 4th hour 3 8, 11, 14 5th hour 2 2, 15 6th hour 6 What would happen if

In this project I am going to examine the time taken for a whole tray of tomatoes to go bad when a single bad tomato is put in a particular position.
Contents Page Introduction Page 3 Part 1 Pages 4 to 7 Part 2 Pages 8 to 16 Conclusion Page 17 Introduction: In this project I am going to examine the time taken for a whole tray of tomatoes to go bad when a single bad tomato is put in a particular position. I will see how this time changes when I vary the size of the tray and alter the starting position. I will start with a small tray and gradually the size of the tray will be larger and also the positions will move from corner to corner, side to side and so on. At the end of this project I want to be able to have a formula which will tell me how long it would take a bad tomato to spread over cover the whole tray when the first bad tomato is placed in a curtain position in the tray. Part 1 The diagram below represents the look of a tray with 16 tomatoes in it. The number 1 is there to show where the first bad tomato began. The other numbers 2,3,4,5 and 6 represent the number of hours that have gone. Therefore for example after two hours in the diagram below in total, which includes the 1 and all the 2s, 4 tomatoes have gone bad. 2 3 4 5 2 3 4 2 3 4 5 3 4 5 6 Hours (n) Total No. Of Bad Tomatoes st Difference 2nd Difference 3 2 4 4 3 8 0 4 4 2 -1 3 5 5 -2 6 6 The table on the previous page tells me what is involved in the nth term. The column labelled '1st Difference' tells