There are two main variables which I must control and they are:
- The soil PH
- The number of leaves counted per sample
Biological Theory:
From looking up reference on the net and taking out information from books I gathered some information that would be useful for background knowledge on the tree I am about to conduct my experiment on and their leaf type.
The Holly tree also known as Ilex Aquifolium and belongs to family of Bartl, can be in the form of a shrub or a small tree and can grow up to 15m high but on odd occasions much larger. The Holly can tolerate either sun or shade, but it requires well drained, slightly acidic and fertile soil. The root system of the holly tree resents being disturbed and therefore cultivating the soil around them can harm the Holly. The bark is smooth and grey but does eventually become fissured with age, The twigs are glabrous and green although they may be pubescent when young, Higher up the stem they tend to become more oval and without spines. Ilex is insect pollinated and poorly dispersed and has low pollen production so it is poorly represented in pollen assemblages, even in samples taken from ground surfaces beneath a woodland canopy containing the tree. As Ilex is dioecious (individuals are either male or female) only half of the population will produce pollen, further limiting its pollen production. The leaves are alternate, simple about 3-10cm long, elliptical-oblong they have a wavy and usually spiny margin, but on old or strongly shaded trees there is often only a terminal spine; they are dark glossy green above, paler beneath and hairless. The leaves are short stalked and minute black stipules. Holly is native over almost the whole of the British Isles in woodland, scrub, and hedges over a wide range of soil types. From calcareous to very poor and acid, and locally forming almost pure woods.
Appearance:
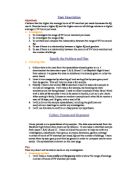
The teeth are pointed, the parts between the teeth are rounded.
Holly (Ilex aquifolium)
Method:
- I will place a tape measurer of about 10 metres around just in front of the Holly tree just like in the diagram above, for example the 0m, 5m, and 10m from above.
- If a 2m ruler is possible I will place or lay on the tree vertically, if not I will tape two 1 meter rulers together then place it, just as I have illustrated it in the diagram, again for example the 0m, 1m and the 2m from above.
The following random coordinates will be used:
- I will then simply start conducting my investigation and gaining my results by using random coordinates for example (5, 1) as I have showed in the diagram.
- I will go to that point on the tree and then in that area take 20 leaves, for each leaf count the number of spikes it has and record it down on a results sheet.
- I will repeat steps 1-4 till I have about 30 samples and therefore the amount of spikes on 20 leaves per sample, thus insuring we get an accurate overall result.
Then for the soil samples.
-
I will take a film pot and gently scoop just over a teaspoon of soil and place within the pot repeat this for the 1st 10 samples and keep aside ready to be tested.
-
I will then take them back to the lab, then for each pot in turn I will pour 10cm³ of ionised water and stir the soil sample with the ionised water until it is roughly dissolved good enough to be tested on
- Then get an electronic PH reader and place in the mixture of ionised water and soil and take down the readings.
Justification of method:
Q1- why is 10 metres used horizontally around in front of the tree.
Q2- why is 2 metres used in height.
Q3- why have you chosen to count 20 leaves for each of the 20 samples..
Q4- why is metres used as an SI unit.
Q5- why are 30 samples carried out in order to conduct the investigation.
Q6- why is the soil mixed with lime water and not just normal water.
Q7- why have I used random sampling.
A1- 10 metres is used for the sake of covering the whole tree in width (horizontally) in order to carry out a more random type sampling in other words have a wider choice.
A2- 2 Metres is used vertically up the tree again for the sake of covering a reasonable length of the Holly tree in its length and again giving us a better chance of sampling randomly and also because 2 metres is of a reasonable reachable length not high up.
A3- I have chosen to count 20 leaves per sample in order to give me more reliable data and to eventually gain a better average in which 10 minimum is most suitable so I have chosen 20 simply for accuracy. And as for the samples doing 30 would be more accurate but due to lack of time that we have it will be too time consuming and their fore 20 is a more appropriate amount to conduct.
A4- Metres is used logically because it’s most suitable in order to cover the tree area, you wouldn’t use cm as a measure of rule for this type of investigation. The amount of spikes on each leaf hasn’t got any SI measurements so it’s just counted in units.
A5- I have chosen to do 30 samples again for the same reason as A3 for accuracy and in order to gain an over all strong clear average and so that on the graph it shows up clearly its correlation.
A6- because the lime water doesn’t interfere with PH of the soil and therefore when the PH reading is taken a clear and unchanged result is taken where as water is of a different PH and will affect this test
A7- I have chosen random sampling because it is unbiased, it means that I can look at an overall area of the tree I will investigate on by not having to choose the spots that I want.
- From all my preliminary investigations that I conducted I realised that the more data collected the more accurate my results will be and the more strong by hypothesis will be if it is correct therefore giving you a good strong average, and when sketching the graph you can then determine if your hypothesis is right or wrong.
SI units of measurement:
The SI units I have decided to use for this investigation is metres for the use of random coordinates and units will be used for counting the number of spikes on the leaves
Equipment needed:
- A 10 metre tape measurer
- A 2 metre vertical ruler
- If possible a chair or ladder in order to reach the higher leaves that’s if 2 metres isn’t within your reach
- Opened Quadrate, not really needed but just gives a better picture of the area that is going to be sampled in
- 10 film pots
- spoon for scooping
- ionised water & PH reader
Number of samples:
I have decided to generate my experiment doing about 30 samples all of which are at different points using random sampling
Proposed statistical test to be used:
As the aim of my experiment is to investigate the spikiness of leaves on a holly tree at a high and low point using random sampling, I will be therefore investigating the relationship between the two points and the amount of spikes on the leaves at the two points. I thought that the best statistical test to use is the Spearesmansrank Coefficient Correlation as it shows the relationship and the nature of the graph being either of negative or positive correlation.
Risks/Hazard:
I have noted down some possible hazards which are not life threatening but worth considering when conducting the experiment.
- The spikes on the leaves are very sharp and can be a risk if it pricks your finger while you are investigating as your wound will be open to any possible diseases or infections.
- Also if reaching for higher leaves in order to count there is a risk of possibly slipping or falling onto the thorns or ground.
- When taking the soil samples make sure you safeguard your hands first because if you have any open cuts this could lead to an infection of some sort 2ndly as it will interfere with the result at the end the PH of your hand could contaminate the soil.
Safety Requirements:
As in all experiments, safety precautions must be followed to ensure that accidents are avoided. In case the site has been littered with broken glassware left by unruly residents; when collecting soil for the measure of pH, check the area before taking the sample. If the site under investigation is muddy, ensure that one treads with care to avoid slipping over. Use all equipment sensibly and carefully with respect to others.
How could I minimise my impact on the chosen habitat?
The habitat in which I will be working in is very open and their really isn’t any great impact that can be caused while conducting my experiment even if I tried but again points worth considering.
- While I am counting the spikes on each leaf I can count them while they are still on the tree instead of having to cut of a whole branch in order to count the spikes on each individual leaf. This is because I did not want to harm the tree or cause any damage to it and also because I didn’t want to disturb any habitats like little insects that may be living on the leaves or the branch.
- After taking the soil samples be-careful not to damage any other vegetation or wildlife living beneath the soil for example killing a worm when scooping out the soil sample, and then carefully patting the soil back so no great changes are caused.
- Littering on the green (e.g. plastic bags, broken glass, etc.) should be avoided and where sighted, must be disposed of in a sensible fashion, as the ingestion of such products by inhabitants could lead to their mortality.
Discussion
My results show that in the higher regions of the holly tree, the spikiness of the leaves decreases. Although the difference in spikiness between the lower and higher region is not stupendous, there is a significant difference. The results are defined by a scatter graph of the average number of spikiness plotted against the height (refer to graph labelled (a)). Although the open quadrate was placed at random points in order to count the spikiness of leaves within, their was a pattern which wasn’t expected. The graph generally shows the that the lower region of the tree has leaves that are much more guarded by spikes.
The dots on the scatter graph show up in a negative correlation again by referring to the graph (a) we interpret that at the height of 0.5 (m) we have a higher number of dots representing the spikiness, then as we move on to the height of 1, 1.5 and 2 metres the dots are less and therefore representing a lower number of spikes at that point, the scatter graph follows a trend it starts of at a lower height with a high number of spikes as you move to a next higher height the spikiness decreases accordingly.
If we refer to graph (b) the bar-chart again compares the results of the spikiness of leaves to the height at which it is found, you can see that there are some purple lines that are taller up representing the average spikiness of leaves and on the same sample number you can also see a blue line representing the height that is not so high. Then you take a look at another sample number with a shorter purple line representing the average spikiness and look at the blue line next to it you will notice its taller. So we realise that as the height of the point being sampled is reaching 2 (m) we notice a decrease in the average of spikes on leaves, and again as the height line goes shorter towards the 0 m height, the average of the spikiness of leaves, line shoots up.
These results that I have obtained clearly back up my hypothesis, that there is a significant relationship between the average spikiness of leaves at a high and low point. Also by performing the spearman’s rank of correlation and applying all the values obtained, I got a negative value of -0.6026316 which explains the negative correlation of my graph, as it tells us the nature of the relationship, taking this value a step further and ignoring the minus, we look at the confidence tables at the number of pairs (n) which represents the number of samples there fore we take 20, then we realise that the closest critical value to the 0.6026316 was 0.591. therefor I can reject the null hypothesis that there is not any significant relationship and accept my original hypothesis as the value was either equal or greater then the critical value giving us a confidence level of 99% which is excellent and fully complies with my hypothesis.
Conclusion
The results of this investigation clearly show that on the higher region of the holly tree the spikiness of each individual leaf is much more less, this could be linked to the adaptation it has undergone over a long period of time in order to protect it self from predators or anything that may consume it in order to survive, which is why the leaves of the holly tree at the lower region is guarded with much more spikes as it is more exposed to predators of any species or form that will consume its leaves.
From research and observations, it appeared that the average spikiness of leaves is not affected by weather conditions, but factors such as light can affect how green each individual leaf is, due to the chlorophyll within. But regardless of the season this holly tree continues to carry its leaves, therefore evergreen and is able to tolerate such conditions.
The pH value collected at 10 points around the holly tree were all roughly the same, I concluded that the pH had no significant relationship nor did it affect the spikiness of the leaves, regardless of the height. It is most likely to affect such factors such as uptake of minerals and nutrients within the soil, as water passing though the soil can remove nutrients in a process known as leaching, the cations dissolve in the water and are washed down through the soil which causes a decrease in soil acidity but again from research I have found that the holly tree is able to tolerate such pH conditions.
Finally no method is perfect, but my investigation was straight forward and doesn’t require much equipment or preparation and naturally quite easily analysed and concluded. It was conducted in a appropriate way thus giving me reliable data that clearly proved and backed my hypothesis in proving that I was correct. Also the fact that my points were chosen randomly could have provoked my results and hypothesis but it didn’t which I was happy about. I didn’t have to cope with any inaccuracies/errors due to the method which I used again for the sole purpose it was straight forward only required you to be able to count so nothing can really go wrong and there is not any method that is better that could be used. I think for the future if this was to be carried out again the only issue they would need to touch on is further studies dig up more biological reasons as to why the spikiness of leaves changes according to the height and what factors affect its leaves and what adaptations it has undergone to cope and tolerate such conditions.
Bibliography/Reference
- Energy and Ecosystems – Nelson Thornes
- Advanced Biology for you – Gareth William’s
- Biology teacher – Ms tibbits
-
Internet search engine –
- Handouts and notes from the board