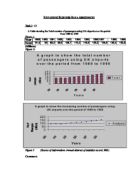
Figure 4:
Comment:
Figure 4 above is a line graph, which shows the total number of passengers using UK airports over the period from 1989 to 1999, it also includes a trend line which identifies the increasing trend of the total number of passengers over the specified period. It also shows a forecast for the years 2000 and 2001. The forecast predicts the total number of passengers that would use the airports if the upward trend continues. The forecast shows that in the year 2000 there should be about 158,000,000 passengers using UK airports and in the year 2001, there should be about 164,000,000 passengers. The forecast is only based on past trends. The forecast cannot be 100% accurate. Certain unexpected events would certainly affect the total number passengers using UK airports. We cannot forecast any unexpected events, which could happen in the future, and for this reason we cannot totally rely on the forecast. Overall, the forecast made, is very realistic and would be very accurate as long as there are not any unexpected events, which would affect this.
Task 2 – (i) Figure:
(ii) Output:
The regression equation is
Opening = 3.94636 + 0.291480 Budget
Predictor Coef SE Coef T P
Constant 3.964 6.468 0.61 0.546
Budget 0.2915 0.1004 2.9 0.007
S = 17.90 R-Sq = 21.9% R-Sq(adj) = 19.3%
Analysis of Variance
Source DF SS MS F P
Regression 1 2701.5 2701.5 8.43 0.007
Residual Error 30 9612.4 320.4
Total 31 12313.9
Unusual Observations
Obs Budget Opening Fit SE Fit Residual St Resid
21 73 92.73 25.22 3.59 67.50 3.85R
22 90 84.13 30.18 4.64 53.95 3.12R
R denotes an observation with a large standardized residual
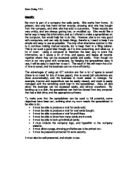
Figure 6:
Pearson correlation of Opening and Budget = 0.468
r = 0.468
(iii) Comment:
Figure 6 is a scatter – plot diagram, it shows the relationship between two variables. In this case how, the gross receipts (for the weekend he movie was released) depends on the total budget for the movie. The regression tells us whether or not the relationship between the two variables is a strong one or not. r = 0,468, this indicates that there is little or no relationship between the total budget and the gross receipts. i.e. as the total budget of the movie increases the gross receipts does not necessarily increase. This is because the r is closer to 0 than +1.
In the scatter plot the response (Y) variable, also known as the dependant variable, is the gross receipts. This variable is supposed to rely on the total budget.
The actual equation is given at the beginning of the output, Opening = 3.94636 + 0.291480 Budget. The value of a is the point where the graph crosses the vertical axis. The value of b can be interpreted as the average increase in y for a unit increase in x.
The output tells us whether there is a real relationship between our variables. The value of p tells us that there is not no certain relationship between the two variables. Any value of P less than .05 generally indicates a relationship. In this case the value of P is 0.007.
The R squared value of 21.9% tells us that 21.9% of the variation in gross receipts can be explained by the total budget.
There are a couple of unusual values. These are the values, which lie further than the regression line than the other observations. The unusual values are for the films, The Lost World and Men in Black.
(iv)
Figure 7:
Figure 8:
Movies released in the summer have a larger range than those not released in the summer.
From figure 8 we can clearly see that the majority of the movies released in the summer have higher gross receipts than those released in other seasons, with a few exceptions.
The movies released in the summer do tend to do better than those in other seasons, but there are some movies which have done well which were released in the other seasons.
Overall we can say that the summer releases would do better than releases in the other seasons.
Bibliography
Sources of task 1: Annual abstract of statistics website
Sources of task 2: “movies.mdf” on the public drive in the sub-directory “MADDOCK”.