Mayfield High School – Coursework
For my project I am investigate the relationship between weight, height and body mass index. I will be investigating how the body mass index varies depending on the age and year group of a student. I will also be investigating how the body mass index varies depending on the gender of a student. I predict that the average BMI for males is going to be higher than the females because the BMI table shows that the average BMI for males is higher than the average BMI for females,
E.g. In normal range for Females it is 19.1- 25.8
In normal range for Males it is 20.7- 26.4
I also predict that the Year group will not really make a difference because the BMI should be the same for each Gender what ever your age. Therefore I think that the Year Group is not a major factor and apart from extreme values, all the averages should be similar.
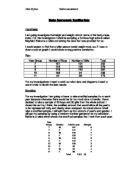
I will take a proportional sample size of 119. I will use stratified sampling to get my 119 students sample size. I used one tenth of each year group to represent the whole year group.
I will need to collect the following information:
Weight, Height, Sex, Year Group, Age. I will also need to find the BMI table, which defines which group each value should fall in to.
I can find this information from the Mayfield High School table.
I have chosen these sources of information because I will need them for my inquiries and to compare the data.
This data is not reliable because there are some extreme values like there is a person who is 4 Metres, 65, and a person who weighs 9 stones. This shows that the data is definitely not reliable. There are quiet a few of outstanding values, and there are also some fields, which have missing data.
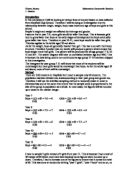
I will use a sample size of 119 because that is approximately 10% of the total data. I used stratified sampling to collect the 119 pieces of data. I used the formula of:
(Total number of boys in a year) * sample size = sample size for boys in that year.
Total number of students
Therefore to work out the sample size of number of boys in year 7 I would do:
(151/1183) * 119= 15
This will be a fair sample size because it has approximately 25 pieces of data for each year group. It also is approximately 10% of the data so the sample size is reasonable.
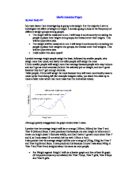
I will use this data to compare the height, weight and body mass index of the students. I will look at how the height and weight contributes to the body mass index.
I will use this data to compare the height, weight and body mass index of each student in the sample window. I will be comparing:
The body mass index of boys and girls