2) How height changes with age – there will not be much of an increase
3) Height and weight according to gender – Males are normally taller and heavier
Data Collection
I have been given is data on Mayfield High School. It consists of 1183 students. In the columns of data are; unique reference numbers, year group, gender, height (m) and weight (kg). From this, I want to look in more detail at 100 students and I will take a random stratified sample. To evade being biased, I will select the students completely random on the computer.
Anomalies
From flicking through the data given to us, I have seen a few errors in the data. Therefore, I will not select them for my research. Reference number 1 has no weight given, so I cannot use this piece of data. Reference number 76 only has a weight of 9kg, which is humanly impossible as they have a height of 1.60m. Also, reference number 159 has a height of 4.65m, which is also humanly impossible. The last piece of data I will not be able to use is reference number 433. It says their weight is 140kg.
Stratified Sample
Number of students is group
X100
Total number of students
This is the way how I found out how many students from each year I needed to choose. There is a total number of 100 students selected, 51 being boys and 49 being girls.
From this data, I will randomly select the data, which I will then investigate, from each student’s reference number. I will do this using the random function (Ran#) on the calculator. Pressing this button will generate a completely random number between 0 and 1; I will then multiply this number by 1183, the total number of students, giving me a completely random number between 1 and 1183.
Hypothesis 1
“The taller you are, the heavier you are”
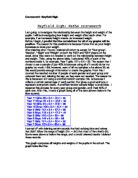
I have now put together all of my data need for hypothesis 1. To be able to compare the height and weight in general, I will put the entire data into one graph and see if there is any strong/weak correspondence between the two.
The graph on the previous page shows the height compared to the weight from 100 students. There is a positive correlation between the height and weight. The correlation co-efficient is 0.70, which does show a strong correlation. This is supported by the graph as most of the points are close to the line of best fit.
However, there is one point which is a long way from the line of best fit. This is known as the outliner. The point is a person who has a height of 1.03m and a weight of 45kg. This is a very low height for that weight but it is possible.
The equation of the line of best fit can be used to find out the average height weight ration for someone.