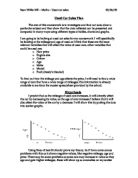
*To work out the gradient, I had to draw a triangle on my graphs and divide the value that was vertical by the horizontal value.
This graph shows the second hand price plotted against the age of every car in Gary’s garage.
You can clearly see the negative correlation of the second hand price decreasing as the age increases.
The triangle drawn on the graph to find the gradient works out as:
6000 / 8.4 = 714.28 (2 d.p)
Now to work out the straight line equation
Y= Second Hand Price
In this case, we would go off the average off all the cars second hand prices (SHP’s), which would be:
(All cars SHP’s added together) (No. Of cars in Gary’s garage)
164030 / 36 = 4556.39(2 d.p)
M= 714.28 (2 d.p)
X= The average of all cars age
(All cars ages added together) (No. Of cars in Gary’s garage)
209 / 36 =5.8 (1 d.p)
C= The average of all cars prices when new
(All cars NP added together) (No. Of cars in Gary’s garage)
379520 / 36 =10542.22 (2 d.p)
This makes this straight-line equation complete
Y=MX+C becomes 4456.39=714.28*5.8 + 10542
Or
SHP = G1A + NP(new price)
Next was the theory that the mileage may affect the 2nd hand price
The graph here shows all the cars mileage plotted against the second hand price.
Once again you can clearly see the negative correlation, showing that when the mileage increases, the second hand price decreases.
The marks ringed in red do not add to the correlation pattern. As with most scattergraphs, there are always a few that do not follow the trend of the others
The equation for this graph is basically the same as the other
Y = MX + C becomes 4456.39=225.17*55195(the average mileage) + 10542
Or
SHP = G2M + NP
(M being for the mileage)
The next factor to consider was the Engine size
From the graph opposite, you can clearly see that there is very little correlation at all in the SHP against the engine size and therefore doesn’t affect the second hand price enough to be able to make an equation from.
One thing about the engine is that the size isn’t the only thing about it that would affect the second hand price. Also the type of engine would make a difference as not all cars are just simply petrol or diesel, some may be four star or unleaded.
Results
For each graph there is a formula, the overall formula is made from all the formulae together. This formula in theory should be able to create the second hand price of a car, just by adding all the relevant data.
SHP = G1A + NP……………1)
SHP + G2M + NP……………2)
Add 1) and 2)
2SHP = G1A + G2M + 2NP………….3)
Divide 3) by 2
SHP = G1A + G2M + NP………..4)
2
4) Is the formula created by combining all others, this in theory should work out all the second hand prices of each cars data that is put in.
To test this I’ll select three cars, all different makes, and use the formula to test how close my formula is to the actual 2nd hand price
Test 1
Ford
SHP = G1A + G2M + NP
2
SHP = (714.28*3) + (0.06*24,000) + 11600
2
SHP = 2142.84 + 1440 + 11600
2
SHP = 15182.84
2
SHP = £7591.42
The actual second hand price is £6970
This answer from my formula is only 6.21% out. Which is quite close.
Test 2
Peugeot
SHP = G1A + G2M + NP
2
SHP = (714.28*4) + (00.6*85,000) + 7,100
2
SHP = 2857.12 + 5100 + 7100
2
SHP = 15057.12
2
SHP = £7528
The actual second hand price according to Gary’s garage is £3350
Therefore I am 41% out, which is not what we want.
Test 3
Vauxhall
SHP = G1A + G2M + NP
2
SHP = (715.28*6) + (0.06*70000) + 16300
2
SHP = 4291.68 + 4200 + 16300
2
SHP = 24791.68
2
SHP = 12395.84
The actual price given by Gary’s garage is £5300
I am 70% out which, once again is not what we want.
The closest of these was the first test, where the formula was only about 6% out.
We can see that there is not enough information in the formula to give exact results, but we still may be able to get closer results by adding more to this equation.
Conclusion
My aim of this investigation was to find out what the second hand price of a car depends upon in Gary’s garage.
My theory at the beginning was that the two main factors of Age and Mileage would have the greatest influence and the engine size would have a slightly less influence, but still add in some way to the coat of the SHP.
I have drawn scattergraphs and noted correlation’s and have found out that yes, my theory was correct, as shown in my scattergraphs. The Mileage and Age affect the 2nd hand price greatly whereas the engine size does not show any affect, but it would change the second hand price in some way.
Although I did find a formula, it is nowhere near as accurate as it could have been, had I been given the right information, suc