GCSE Maths Statistics Coursework
GCSE Statistics Coursework
Introduction
Scenario: I am not very good at estimating lengths so I am going to find out how to improve it.
1) Is the ability to estimate the length of a straight line related to mathematical ability?
Null hypothesis: There is a relationship between the ability to estimate the length of a straight line and mathematical ability.
Alternative hypothesis: There is no relationship between the ability to estimate the length of a straight line and mathematical ability.
2) Does the estimation of a non straight line improve after practice?
Null hypothesis: Practice improves the estimate of a non-straight line.
Alternative hypothesis: Practice doesn't improve the estimate of a non-straight line.
3) Does a 14/15 year olds ability to estimate the length of a straight line fit a normal distribution?
Null hypothesis: A 14/15 year olds ability to estimate a straight line fits a normal distribution.
Alternative hypothesis: A 14/15 year olds ability to estimate a straight line doesn't fit a normal distribution.
4) Are a 14/15 year olds ability to estimate a straight line more accurate than estimating a non straight line?
Null hypothesis: A 14/15 year olds ability to estimate a straight line is more accurate than estimating a non straight line.
Alternative hypothesis: A 14/15 year olds ability to estimate a straight line is less accurate than estimating a non straight line.
I will experiment on 14/15 year olds in England as they use the same curriculum and thus have the same, if not similar education and experience. All pupils will have used a ruler before so they will know the approximate length of 30cm and 15cm lines. Year 10 at Stamford School and Stamford High School represent a small sample of year 10 pupils in England. Year 10 in the Stamford Endowed schools is a good choice as every person has have the exact same education and experience and the data is reasonably easy to collect. Every person has used the same facilities, books and material and the teachers have all been taught using the same course. Although there maybe some problems and anomalies with this sample because someone maybe away, someone maybe blind or have eye problems and someone might be handicapped. For each question I will use a certain sample of year 10's at Stamford Endowed schools.
To get this data I need to get a person to measure a line and a non straight line in an experiment. I need to make the experiment fair, so I need the same controlled experiment for each person who does the experiment. The pupils will enter a room and look at a straight line and a non straight line and ask them to estimate it in mm. There are many things which need to be done to keep the experiment the same for each person:
* Make the time given the same for each person.
* Each person must be the same distance from the line.
* Each person must be the same angle and height.
* Keep the line the same length, same thickness, same colour and on the same background.
* Don't make the line too big or small.
* The person must be on their own so that there is no conferring.
* Each person must leave without speaking to anyone.
* Everyone must be given the same instructions and told the same degree of accuracy to estimate in.
* Make sure the lighting conditions are the same for each pupil.
* Make sure the pupil has no object which they can use to aid their estimation.
* Have an incentive to make sure there are as few silly answers as possible.
These are examples of the lines which are going to be estimated. The actual lines are at the back of my project:
I got this trial data by doing the experiment:
Straight Line (mm)
Non Straight Line (mm)
st Practice (mm)
2nd Practice (mm)
3rd Practice (mm)
Non Straight Line After Practice (mm)
260
300
300
450
800
69
355
400
330
450
000
323
280
400
250
575
950
260
350
400
450
650
900
265
300
350
450
500
999
323
280
320
60
513
967
76
222
322
337
489
923
252
284
302
327
473
949
227
280
304
402
427
761
211
400
380
250
360
300
300
245
345
200
343
777
299
210
280
340
530
790
210
265
280
370
545
200
215
267
260
275
526
975
41
360
640
300
283
271
261
250
220
90
241
265
243
213
297
364
255
205
235
270
290
70
230
243
60
273
228
231
267
298
367
350
350
43
...
This is a preview of the whole essay
340
530
790
210
265
280
370
545
200
215
267
260
275
526
975
41
360
640
300
283
271
261
250
220
90
241
265
243
213
297
364
255
205
235
270
290
70
230
243
60
273
228
231
267
298
367
350
350
43
250
360
300
The red results represent the three practices and are not needed. 14 out 26 results have been estimated to the nearest cm.
Question 1
Is the ability to estimate the length of a straight line related to mathematical ability?
Null hypothesis: There is a relationship between the ability to estimate the length of a straight line and mathematical ability.
Alternative hypothesis: There is no relationship between the ability to estimate the length of a straight line and mathematical ability.
Sampling
I need to sample to get the results for Mathematical ability. There are 86 boys in Y10 doing Mathematics. They are distributed over 5 sets. I think that the best way to portray mathematical ability is to take their most recent exam result. I can get these results off the school database. I am going to use the end of year exam results. Set 5 boys did not do the same exam so these boys will not be sampled.
I am going to use Percentage/Quota stratified sample selection.
Set 1 25 pupils 50% quota is 26/2 =13 13 results
Set 2 24 pupils 50% quota is 24/2 =12 12 results
Set 3 18 pupils 50% quota is 18/2 =9 9 results
Set 4 17 pupils 50% quota is 18/2 =9 (I rounded as you 9 results
can't get half a
person)
There is a total of 43 results. However 2 boys were away and 1 boy was away for the whole term so you end up with 40 sets of data. Each set is listed alphabetically in the Sims database. These entries were numbered and then using a calculator and the random button the sample names were collected.
e.g Set 1: RND × 26 gave 13.346. This converts to 14th name using the rounding up method. The 14th boy in the set was the first to be selected etc...
Result Number
Distance predicted
Difference from actual
Exam mark (%)
72
62
44
2
76
58
8
3
82
52
30
4
86
48
58
5
203
31
70
6
209
25
53
7
210
24
43
8
211
23
32
9
217
7
80
0
226
8
39
1
228
6
78
2
232
2
46
3
232
2
62
4
235
80
5
240
6
77
6
241
7
71
7
242
8
52
8
243
9
21
9
243
9
49
20
245
1
70
21
250
6
51
22
250
6
70
23
250
6
91
24
255
21
68
25
256
22
83
26
257
23
51
27
258
24
62
28
263
29
95
29
265
31
70
30
267
33
70
31
268
34
53
32
270
36
66
33
270
36
47
34
272
38
8
35
274
40
64
36
274
40
53
37
282
48
27
38
285
51
49
39
300
66
64
40
317
83
26
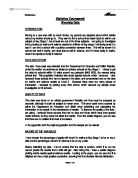
Here is a scatter graph showing the data with a line of best fit:
The data from was put into
I put in the line of best fit which runs through the mean point. This is called the centroid point in Autograph. All data related to this scatter graph can be found in the results box.
The correlation coefficient is -0.3979. This shows a low degree of negative correlation between the two variables. Those good at maths achieved smaller differences in estimation and thus were more accurate.
To a certain degree of accuracy, this proves my null hypothesis.
The y on x regression line y=0.4009x + 67.42
The line of best fit y=0.4009x + 67.42
The 67.42 shows where the line crosses the exam mark axis and the -0.4009 gives the
gradient of the line.
The y on x regression line is the same as the line of best fit.
I can use this equation to estimate what exam mark a boy would get if his error in estimation was 30. I need to substitute in 30cms as the x:
y=0.4009 × 30 + 67.42 = 55.393 (This is not the exact exam result, it is only an
estimate)
If I wanted to estimate someone's error in estimation, I would use the x on y
regression line which is -0.3949x + 50.02. I am going to use an exam result of 70.
Y= -0.3949 × 70 + 50.02 = 22.377
These results are not very accurate as the correlation is not strong.
Question 2
Does the estimation of a non straight line improve after practice?
Null hypothesis: Practice improves the estimate of a non-straight line.
Alternative hypothesis: Practice doesn't improve the estimate of a non-straight line.
Sampling
I have 86 results for boys but only 52 results for girls. I only have 52 results for girls as the High School wouldn't allow the experiment to be carried out in lessons. Instead, the experiment was carried out at lunchtime so there was not a full attendance. Some girls wouldn't do it if they didn't have to.
I used the method of Percentage/Quota Stratified random sample selection. I ended up with 45 results for both boys and girls. This gives me a total of 90 results which will be used in questions 3 and 4 as well as this one.
Here are the 90 sets of data:
Non st.line length
Diff from 351
Non St. after prac.
Diff from 211
85
-166
10
-101
238
-113
30
-81
72
-179
35
-76
263
88
45
-66
72
79
45
-66
89
-162
50
-61
290
-61
50
-61
500
49
50
-61
280
-71
55
-56
340
-11
55
-56
285
66
55
-56
262
-89
60
-51
280
-71
60
-51
308
43
62
-49
280
71
64
-47
315
36
69
-42
249
02
69
-42
300
-51
70
-41
400
49
70
-41
480
29
70
-41
80
71
72
-39
219
32
73
-38
250
-101
75
-36
270
81
75
-36
200
-151
80
-31
250
-101
80
-31
314
37
84
-27
221
30
87
-24
245
-106
90
-21
270
-81
95
-16
297
54
96
-15
314
37
97
-14
300
51
98
-13
305
-46
99
-12
200
-151
200
-11
424
-73
200
-11
300
-51
200
-11
310
41
200
-11
303
-48
202
-9
355
-4
202
-9
450
-99
203
-8
225
-126
205
-6
300
-51
207
-4
357
6
207
-4
97
54
209
-2
200
-151
210
-1
210
-141
210
-1
250
-101
210
-1
300
-51
210
-1
310
-41
210
-1
322
-29
210
-1
350
-1
210
-1
348
3
210
-1
300
51
210
-1
250
01
210
-1
350
-1
212
325
26
212
309
42
212
342
9
213
2
325
-26
215
4
363
-12
215
4
410
59
220
9
315
36
225
4
283
68
229
8
370
-19
230
9
323
-28
238
27
368
-17
238
27
230
-121
240
29
290
-61
240
29
370
9
240
29
349
2
243
32
302
49
243
32
392
-41
244
33
428
-77
245
34
300
-51
250
39
400
-49
250
39
400
-49
250
39
500
49
260
49
421
-70
266
55
411
-60
266
55
453
-102
267
56
244
07
268
57
433
-82
273
62
427
-76
275
64
200
-151
280
69
242
09
283
72
52
-199
290
79
200
-151
300
89
250
-101
320
09
230
-121
370
59
Here is a histogram to show the results before practice with a box and whisker plot
and + and - 3 standard deviations:
The box and whisker plot relates to the raw data. The median is roughly -40 and 50%
of the results are between -80 and 60. The + and - 3 standard deviations show that
the mean in roughly -20. The histogram relates to grouped data. It shows that more
people underestimated than overestimated.
This is the information on the histogram which I have taken from Autograph and put
into word.
Grouped Data Statistics
Total Frequency, n:
90
Mean, x:
-19.5556
Standard Deviation, x:
91.1154
Modal Class:
-80-
Lower Quartile:
-85.4545
Median:
-36
Upper Quartile:
51.6667
Semi I.Q. Range:
68.5606
Raw Data Statistics
Number in sample, n:
90
Mean, x:
-18.9667
Standard Deviation, x:
90.1252
Range, x:
378
Lower Quartile:
-83.75
Median:
-28.5
Upper Quartile:
49
Semi I.Q. Range:
66.375
Here is a histogram to show the results after practice with a box and whisker plot
and + and - 3 standard deviations:
The median is roughly 20 and 50% of the results are between -40 and 30. The
histogram shows that most of the data is near 0 and roughly fits a normal distribution.
The + and - 3 standard deviations show that the mean in roughly 0.
This is the information on the histogram which I have taken from Autograph and put
into word.
Raw Data Statistics
Number in sample, n:
90
Mean, x:
-1.75556
Standard Deviation, x:
44.5741
Range, x:
260
Lower Quartile:
-36.5
Median:
-1.5
Upper Quartile:
29
Semi I.Q. Range:
32.75
Grouped Data Statistics
Total Frequency, n:
90
Mean, x:
-6.66667
Standard Deviation, x:
44.6219
Modal Class:
-40-
Lower Quartile:
-37.1429
Median:
-11.4286
Upper Quartile:
22.7273
Semi I.Q. Range:
29.9351.
Having looked at both sets of results, I can see that there is a clear improvement in estimation after practice. To a certain degree of accuracy, this proves my null hypothesis.
Question 3
Does a 14/15 year olds ability to estimate the length of a straight line fit a normal distribution?
Null hypothesis: A 14/15 year olds ability to estimate a straight line fits a normal distribution.
Alternative hypothesis: A 14/15 year olds ability to estimate a straight line doesn't fit a normal distribution.
The data I am using is the same as in question 2 and 4. Here are the results for estimating the length of a straight line
St line length
Diff from 234
52
-82
95
-39
72
-62
263
29
72
-62
89
-45
320
86
245
1
240
6
250
6
265
31
256
22
210
-24
258
24
210
-24
257
23
284
50
250
6
200
-34
50
-84
250
6
226
-8
250
6
270
36
200
-34
250
6
228
-6
81
-53
80
-54
270
36
232
-2
257
23
211
-23
200
-34
230
-4
274
40
250
6
240
6
200
-34
255
21
203
-31
225
-9
250
6
282
48
86
-48
250
6
240
6
248
4
75
-59
240
6
276
42
270
36
243
9
250
6
235
289
55
82
-52
267
33
243
9
323
89
241
7
230
-4
245
1
232
-2
250
6
37
-97
76
-58
240
6
250
6
250
6
274
40
209
-25
282
48
285
51
300
66
210
-24
300
66
250
6
242
8
270
36
317
83
268
34
272
38
256
22
200
-34
217
-17
95
-39
50
-84
250
6
200
-34
This is a normal distribution:
Here is a histogram with a normal distribution curve to show how well the results fit a normal distribution:
The class intervals were changed to make the histogram fit the normal distribution curve better.
This is the information on the histogram which I have taken from Autograph and put
into word.
Class Int.
Mid. Int. (x)
Class Width
Freq.
Cum. Freq.
Freq.
-100 § x < -60
-80
40
6
6
0.15
-60 § x < -40
-50
20
7
3
0.35
-40 § x < -20
-30
20
4
27
0.7
-20 § x < 20
0
40
35
62
0.875
20 § x < 40
30
20
5
77
0.75
40 § x < 60
50
20
8
85
0.4
60 § x < 100
80
40
5
90
0.125
Raw Data Statistics
Number in sample, n:
90
Mean, x:
2.3
Standard Deviation, x:
39.1866
Range, x:
86
Lower Quartile:
-26.5
Median:
0
Upper Quartile:
25.25
Semi I.Q. Range:
25.875
Grouped Data Statistics
Total Frequency, n:
90
Mean, x:
0
Standard Deviation, x:
38.5861
Modal Class:
-20-
Lower Quartile:
-26.4286
Median:
0.571429
Upper Quartile:
27.3333
Semi I.Q. Range:
26.881
In a normal distribution the + and - 3 standard deviations have a certain amount of results between it. In the 1st + and - standard deviation there are 67% of results between it. In the 2nd + and - standard deviation there are 95% of results between it. In the 3rd + and - standard deviation there are 100% of results between it.
I can show the amount of results between the + and - 3 standard deviations by using probability. I am going to overlap the histogram:
Between the 1st + and - standard deviation, - 37 and 41 there are 69% of results. This is very close to 67%. It shows a strong similarity between the results and also, a normal distribution.
This histogram shows the results between the 2nd + and - standard deviation:
Between the 2nd + and - standard deviation, - 76 and 80 there are 93% of results. This is very close to 95%. It shows a strong similarity between the results and also, a normal distribution.
There are 100% of results are between the 3rd + and - standard deviation and shows strong similarities between the results and a normal distribution.
My results fit a normal distribution and this proves my null hypothesis.
Question 4
Are a 14/15 year olds ability to estimate a straight line more accurate than estimating a non straight line?
Null hypothesis: A 14/15 year olds ability to estimate a straight line is more accurate than estimating a non straight line.
Alternative hypothesis: A 14/15 year olds ability to estimate a straight line is less accurate than estimating a non straight line.
I am going to use the same data as I used in questions 2 and 3. Here is the data from excel:
St line length
Diff from 234
Non st.line length
Diff from 351
52
-82
85
-166
95
-39
238
-113
72
-62
72
-179
263
29
263
88
72
-62
72
79
89
-45
89
-162
320
86
290
-61
245
1
500
49
240
6
280
-71
250
6
340
-11
265
31
285
66
256
22
262
-89
210
-24
280
-71
258
24
308
43
210
-24
280
71
257
23
315
36
284
50
249
02
250
6
300
-51
200
-34
400
49
50
-84
480
29
250
6
80
71
226
-8
219
32
250
6
250
-101
270
36
270
81
200
-34
200
-151
250
6
250
-101
228
-6
314
37
81
-53
221
30
80
-54
245
-106
270
36
270
-81
232
-2
297
54
257
23
314
37
211
-23
300
51
200
-34
305
-46
230
-4
200
-151
274
40
424
-73
250
6
300
-51
240
6
310
41
200
-34
303
-48
255
21
355
-4
203
-31
450
-99
225
-9
225
-126
250
6
300
-51
282
48
357
6
86
-48
97
54
250
6
200
-151
240
6
210
-141
248
4
250
-101
75
-59
300
-51
240
6
310
-41
276
42
322
-29
270
36
350
-1
243
9
348
3
250
6
300
51
235
250
01
289
55
350
-1
82
-52
325
26
267
33
309
42
243
9
342
9
323
89
325
-26
241
7
363
-12
230
-4
410
59
245
1
315
36
232
-2
283
68
250
6
370
-19
37
-97
323
-28
76
-58
368
-17
240
6
230
-121
250
6
290
-61
250
6
370
9
274
40
349
2
209
-25
302
49
282
48
392
-41
285
51
428
-77
300
66
300
-51
210
-24
400
-49
300
66
400
-49
250
6
500
49
242
8
421
-70
270
36
411
-60
317
83
453
-102
268
34
244
07
272
38
433
-82
256
22
427
-76
200
-34
200
-151
217
-17
242
09
95
-39
52
-199
50
-84
200
-151
250
6
250
-101
200
-34
230
-121
This histogram shows the difference in estimation on the straight line. It looks very strange. This is because I wanted to keep the scale the same so it was easy to compare the two histograms. All the results are within 100m either side of the actual, which shows the estimations are quite accurate and the range of the estimations was 186mm. The box and whisker shows that the median of estimates were overestimates rather than underestimates.
Raw Data Statistics
Number in sample, n:
90
Mean, x:
Standard Deviation, x:
39.1866
Range, x:
86
Lower Quartile:
-26.5
Median:
0
Upper Quartile:
25.25
Semi I.Q. Range:
25.875
Grouped Data Statistics
Total Frequency, n:
90
Mean, x:
2
Standard Deviation, x:
39.8664
Modal Class:
0-
Lower Quartile:
-26.4286
Median:
7.40741
Upper Quartile:
27.3333
Semi I.Q. Range:
26.881
This histogram shows the difference from the actual non-straight line. It has a much wider spread of results ranging from -200m to 200m away from the actual length. This is on the congruent scale to the straight line so I can see the difference between the two. It is obvious that the non-straight line estimations are worse already because of the range of results. The box and whisker plot shows that the median of results were underestimates. The range of the box and whisker is also much greater. The range of results was also 378mm. This shows poor estimations
Raw Data Statistics
Number in sample, n:
90
Mean, x:
2.3
Standard Deviation, x:
39.1866
Range, x:
86
Lower Quartile:
-26.5
Median:
0
Upper Quartile:
25.25
Semi I.Q. Range:
25.875
Grouped Data Statistics
Total Frequency, n:
90
Mean, x:
2
Standard Deviation, x:
39.8664
Modal Class:
0-
Lower Quartile:
-26.4286
Median:
7.40741
Upper Quartile:
27.3333
Semi I.Q. Range:
26.881
The graph above shows the results for both the straight line and non-straight line estimations. It is clear to see that the estimations for the straight line are much more accurate and precise compared to the non-straight ones. This proves my null hypothesis. If you also compare the two box and whisker plots this gives evidence to prove my null hypothesis.
I can conclude that a 14/15 year olds ability to estimate a straight line is more accurate than estimating a non straight line.
Iain Downer 1