As we can see in the above graph, the vertex (turning point of a graph) is located every time on the y-axis. The parabola is the same size and shape though it is translated vertically, depending on the value of k. The reason why the parabola is translated rests with the fact that we either adding or subtracting a certain value from all points on the graph, thus pushing the graph up or down the y-axis. Another point worth mentioning would be that the vertex is actually the value of k.
In this second part, we will investigate what happens when we subtract h and square the value, giving us y = (x - h) 2
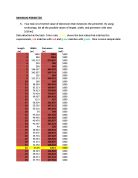
Again, I chose different values for h to use against the different values of x. For h I chose:
y1 = (x - 13) 2
y2 = (x - 4) 2
y3 = (x +5) 2
y4 = (x + 7) 2
y5 = (x - 19) 2
Making the table:
With these results the below graph was given:
We can clearly see the same parabola repeated, however, as opposed to the graph of y=x2 + k, the graphs are moved horizontally, giving us a horizontal transformation. The reason for this translation is that the value of x is being directly changed whereas with the previous equation, the value of x was simply being added or subtracted onto.
Again, the vertex is directly changed according to the value of k.
In the third part, we will see what will happen when we put these two functions x2+k and (x-h) 2 together and how this influences a graph. The two functions put together will make:
y1 = (x - 13) 2 + 6
y2 = (x - 4) 2 + 5
y3 = (x +5) 2 – 8
y4 = (x + 7) 2 + 22
y5 = (x - 19) 2 – 15
Hand-drawn graph for (x – h) 2 + k
Coordinates for graph:
Confirmation of graph with technology:
In this graph, we can see that the vertex of each different graph is now translated diagonally. Meaning that firstly it is affected by h, translating it horizontally, and then translated vertically by the value of k. Again, the parabolas for all the graphs are the same, only their positioning on the graph differs.
In this next part, we will introduce a new constant, a. We will apply a to y=x2 by multiplying it to x, giving us y=ax2
y1 = 3*x2
y2 = 6*x2
y3 = -8*x2
y4 = -26*x2
y5 = 17*x2
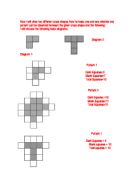
As opposed to the previous graphs, the vertex for all of these graphs stay the same, however, their parabola shapes change. I notice that the higher the value of a, the narrower the parabola is. Meaning that all vertex points meet at 0 but the parabola becomes wider/narrower depending on the values of x.
As I have attempted to explain in this diagram, the different values of a affect the individual points of a graph and this causes the overall line to be either pushed up making the line steeper.
The reason why some of the parabolas are negative is simply because there is a negative amount of x.
In this final part, we will investigate what happens when we put all of these functions together, giving us the equation of a (x - h) 2+ k.
y1 = 3*(x - 13) 2 + 6
y2 = 6*(x - 4) 2 + 5
y3 = -8*(x +5) 2 – 8
y4 = -26*(x + 7) 2 + 22
y5 = 17*(x - 19) 2 – 15
In this graph, we have a combination of all of the changes made by each constant. We have the vertical translation from adding k, the horizontal translation from subtracting h and squaring it, and finally the stretch from multiplying x by a.
Through this investigation, I have learnt how to properly graph functions and also how different values affect a graph depending on how you use them.