I cannot make this experiment very accurate, as other factors will affect the distribution of daisies other than light, these factors I cannot control. Factors such as rainwater, human activity on the grassland, etc are not possible to control. These factors I must take into account when I write my conclusion.
To collect my results I can use various means.
- The Transect
This is a line into the habitat and things along the line get recorded.
- The Quadrat
This is a study area, ¼ m², 1m² or larger
Measurements Within The Quadrat
Count individuals (No. of daisies per m²)
Count squares (% occurrence How many squares have daisies growing in them.
% Cover How much of the quadrat is covered by the plant.
I am going to use a quadrat and I will measure and record the plants using % Occurrence but I will also have a Transect running through the area so I can lay down my quadrat at equal distances making it more accurate.
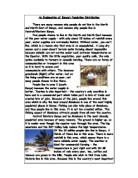
I predict that more daisies, and other plants, will be found in Area 1 it has more sunlight reaching the grass, allowing plants to photosynthesise and produce food to survive.
Results
Area 1
Area 2
I will produce a graph that will show the comparison between the daisies only and also I will produce a graph to compare all plants. This will be excluding Yarrow as I only occurred in Area 1.
Comparison of Daisies
Comparison of all plants
Conclusion
I have found that more plants are found in Area 1. This is because of what I said in my Planning and prediction. Not only sunlight affects the growth of plants but so does the level of water it can get, with an over hang of trees much of the rain water never reaches the ground and therefore there is less water to collect. Also much debris from the trees may fall and damage some of these plants meaning they die.
From my graph you can see that the plant population is changed considerably between Area 1 and Area 2. Clover especially shows this as it contains a high population in Area 1 while in Area 2 there is hardly any found.
Evaluation
I thought my results were collected very well and that the method I used made collecting this data possible. The procedure used was very good but could easily be improved.
My results were very reliable as I made my Transect went straight through the middle meaning the results collected were an example of the whole area. The results may not have been reliable as they could be because the grass had recently been cut in areas and in some areas it hadn’t. This is shown by one anomaly, which has been circled, it shows a strange drop in one section.
I think my procedure was pretty good but I could have made some changes. I could have collected more data from each area. It would have been a good idea to compare and collect results from other people who have done different parts of the area, this would have allowed me to check my work so I could make it more reliable.
The results gained are reliable enough to produce a conclusion on whether light effects the number of daisies. But I do not think this data is reliable enough to strongly say that is this factor which affects the growth of daisies, as the amount of water is affected by the overhang meaning area 2 would get less water to area 1.
To check that my results are reliable and to gain extra results you could plant seeds in soil and deprive one area of land of light, only a little can get through, while the other part has plenty of light. You could do this with trays of soil with plant seeds in, also they must have access to water otherwise are results will not be fair. To see if water affects the growth of plants we could do that same experiment except they get equal amounts of light, but the amount of water they get varies between the trays. This could be done to find out what factors affect plant population the most and what factors don’t affect the plant numbers.