Conclusions
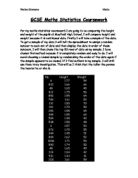
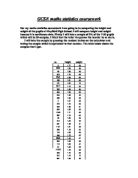
The weight and height graph supports my original hypothesis as it shows positive correlation. I used a scatter graph to display this information because the data was very spread out and most suitable for a scatter graph. Also, I have found that this coursework has assisted me in many ways. As well as allowing me to have and develop a further insight into statistics, I also understand how it would affect people in their everyday lived. Like take for example,, I have learnt these mnemonics in medicine –
Bowel components [ID 189]
"Dow Jones Industrial Average Closing Stock Report":
_ From proximal to distal:
Duodenum
Jejunum
Ileum
Appendix
Colon
Sigmoid
Rectum
_ Alternatively: to include the cecum, "Dow Jones Industrial Climbing Average Closing Stock Report".
Knowledge Level 1, System: Alimentary
Anonymous Contributor
Diaphragm apertures: spinal levels Hi Yield [ID 3225]
Aortic hiatus = 12 letters = T12
Oesophagus = 10 letters = T10
Vena cava = 8 letters = T8
Knowledge Level 1, System: Alimentary
Oriade Adeoye Dept. of Medicine, College of Health Sciences, OAU, Ile-Ife
Duodenum: lengths of parts [ID 58]
"Counting 1 to 4 but staggered":
1st part: 2 inches
2nd part: 3 inches
3rd part: 4 inches
4th part: 1 inch
Knowledge Level 5, System: Alimentary
Anonymous Contributor
Liver inferior markings showing right/left lobe vs. vascular divisions [ID 114]
There's a Hepatic "H" on inferior of liver. One vertical stick of the H is the dividing line for anatomical
right/left lobe and the other vertical stick is the divider for vascular halves. Stick that divides the liver into
vascular halves is the one with vena cava impression (since vena cava carries blood, it's fortunate that it's
the divider for blood halves).
Knowledge Level 5, System: Alimentary
Robert O'Connor University College Dublin
Meckel's diverticulum details Hi Yield [ID 72]
2 inches long.
2 feet from end of ileum.
2 times more common in men.
2% occurrence in population.
2 types of tissues may be present.
_ Note: "di-" means "two", so diverticulum is the thing with all the twos.
Knowledge Level 2, System: Alimentary
Robert O'Connor University College Dublin
Aorta vs. vena cava: right vs. left Hi Yield [ID 2516]
Aorta and right each have 5 letters, so aorta is on the right.
Vena and cava and left each have 4 letters, so vena cava is on the left.
Knowledge Level 1, System: Cardiovascular
Robert O'Connor University College Dublin
Aortic arch: major branch order [ID 29]
"Know your ABC'S":
Aortic arch gives rise to:
Brachiocephalic trunk
left Common Carotid
left Subclavian
_ Beware though trick question of 'What is first branch of aorta?' Technically, it's the coronary arteries.
Knowledge Level 1, System: Cardiovascular
Anonymous Contributor
Atrioventricular valves Hi Yield [ID 2681]
"LAB RAT":
Left Atrium: Bicuspid
Right Atrium: Tricuspid
Knowledge Level 1, System: Cardiovascular
Amir A. Ghaferi Johns Hopkins School of Medicine
Axillary artery branches [ID 1208]
"Screw The Lawyer Save A Patient":
Superior thoracic
Thoracoacromiol
Lateral thoracic
Subscapular
Anterior circumflex humeral
Posterior circumflex humeral
Alternatively: "Some Times Life Seems A Pain".
Knowledge Level 2, System: Cardiovascular
Anonymous contributor and Joe Azzopardi Not specified and Xarabank
Brachial artery: recurrent and collateral branches [ID 608]
"I Am Pretty Sexy"
Inferior ulnar collateral artery goes with Anterior ulnar recurrent artery.
Posterior ulnar recurrent artery goes with Superior ulnar collateral artery.
_ Alternatively: "I Am Pretty Smart".
Knowledge Level 5, System: Cardiovascular
Paul's Boutique Western University College of Osteopathic Medicine of the Pacific
Carotid sheath contents [ID 669]
"I See 10 CC's in the IV":
I See (I.C.) = Internal Carotid artery
10 = CN 10 (Vagus nerve)
CC = Common Carotid artery
IV = Internal Jugular Vein
Knowledge Level 1, System: Cardiovascular
Anonymous Contributor
Cavernous sinus contents Hi Yield [ID 1094]
O TOM CAT:
O TOM are lateral wall components, in order from superior to inferior.
CA are the components within the sinus, from medial to lateral. CA ends at the level of T from O TOM.
_ See diagram.
Occulomotor nerve (III)
Trochlear nerve (IV)
Ophthalmic nerve (V1)
Maxillary nerve (V2)
Carotid artery
Abducent nerve (VI)
T: When written, connects to the T of OTOM.
Knowledge Level 4, System: Cardiovascular
Jonathan Vafai New York University School of Medicine
Coelic trunk: branches Hi Yield [ID 1833]
Left Hand Side (LHS):
Left gastric artery
Hepatic artery
Splenic artery
Knowledge Level 1, By Mike Weston