The question I will attempt to answer are:
- Who is taller boys or girls in each year group
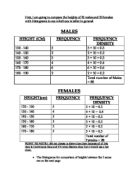
I will take a random sample from each year of 70 people; I have decided I am not going to include the 6th form in my statistical report so it is on years 7 through to 11 my samples will be stratified. For years 7 and 9 the number of boys and girls is very close together so I will just take a sample of 35 people of each sex for these years, the other years I will take a stratified sample and this is how i will do it, as I want a sample of 70 people in the year I will divide 70 by the total number in each year, I will then times this number by the number of boys and the number of girls and it will give me a fair ratio sample of boys and girls. Here is how many boys and girls I will be taking from each year.
To decide how to take my sample I used a random number table so every person had the same chance of being picked.
All my samples are at the back of my report from my samples I have found the mean, mode, median, and range.
I will produce a graph of the averages so we can see what happens through each year. As you will see from my averages graph the girls start of slightly taller in years 7 and 8 but then the girls don’t seem to grow in year 9 and the boys end up a lot taller then the girls.
I will now produce a histogram to crate a visual impression for year 7 boys and girls.
Year 7 girls-
Yr 7 boys –
My histograms give a good visual impression of my data.
The simplest measure of spread is the range but it does not take in to account the extremes in the data, A better measure of spread is the inter quartile range because it ignores the extreme values I will get the inner quartile range from a cumulative frequency graph. I will draw a cumulative frequency graph for each years 8 and 11 putting the girls and boys on the same graph
Year 8 girls-
Year 8 boys-
Year 11 girls-
Year 11 boys-
As you can see on my cumulative frequency graphs I have marked the inner quartile ranges in. in Year 8 a better measure of spread would be the inner quartile range this is –
Girls: 167.5-150=17.5
Boys: 162.5-150=12.5
And year 11
Girls: 166-155.5= 10.5
Boys: 181-173.5= 7.5
Even though the inner quartile range is a better measure of spread then the range, a better measure of spread would take into account every piece of data The standard deviation does exactly this but as my report is based on a sample I must use the formula for sample variance, the formula is -
S2= 1/n-1 (∑x2 - nx2)
I will use the sample variance for year 7 boys and girls and I will compare the results.
Year 7 boys- Year 7 girls
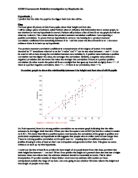
I will now attempt the question do tall people have big feet unfortunately I have only time to do this on boys in one year group here I have picked to do year 9 as it is in the middle of the school.
All I can do is plot a scatter diagram as I do not have enough statistics to do this question in detail.
As you can see my scatter diagram has a positive correlation so year 10 boys in our school follow the statement do tall people have big feet. Of course I only used a small sample and all from the Anglo European school, so my report is not reliable as there may be something peculiar about the people in my school.
From my report I can see that at the beginning of the school girls are slightly taller but by the end of the school boys are a lot taller then the girls. If I could have continued my report I would have liked to do the standard deviation of al the years and would have liked the produce a cumulative frequency graph for more then 2 years. I would have also liked to attempt the harder question- tall people have big feet on more then year 9 boys.