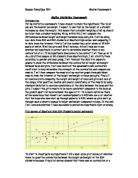
From the results there is a fairly strong positive correlation between the height and weight this is clearly shown by the line of best fit (the blue line).
Stratified Sample
I have done a stratified sample of the Height and Weight between boys and girls. For my stratified sample I recorded the number of males and females in each year group for KS3 and KS4 in a table and then found the sum of the numbers. I then worked out the number of people in each group for my stratified sample by using the formula below. The results are shown in the second table. I had to make sure that I had an even number of boys and girls for my sample to make it fair so decided on having a sample of 30 boys and 30 girls but when I stratified all my data my total only added up to 59 instead of 60 which meant I had to round one of my numbers up, the highlighted number in the second table was originally 4.45 so instead of rounding down I rounded up to make my sample even. I then sorted my data by year group and then gender wise to make it easier to select the stratified number of pupils from the data. I then chose the amount of students at random by once again by using the random button (RAN#) on my calculator and then multiplying it by the amount of data to give me a random number within my data range; I then recorded the height and weight of the person. I did it at random so the results would be fairer and unbiased. I then entered the information in a scatter graph and added a line of best fit to make my results clearer to read. The results are shown below
Formula example = 151/ 604 = 0.25 * 30 = 7.5
Stratified sample of Height and Weight
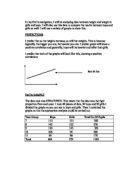
From the graph you can see that there is a fairly strong positive correlation between the height and weight of the stratified sample of the boys and girls combined, the line of best fit shows this clearly. To see the strength of the correlation I decided to use Spearman’s Rank Correlation Coefficient which is 0.47, this means it is fairly strong correlation. The way I did this was to first sort the data from highest to lowest and rank it from 1 to 60; 1 being the lowest and 60 being the highest. I then looked to see if there were any tied values in the data and when there were I added the ranks up of the tied values and divided it by the amount of tied data there was, so if there was 3 people that had the same weight of 60 kg and the ranks were 15, 16 and 17, I would add the ranks up to make 48 and dived it by 3 so the rank of the three peoples weight would be 16. I did this for both the height and the weight. After I had ranked the data I had to find the difference between each of the ranks between the height and the weight and then square it so if I had any negative values squaring it would make it positive. I then added all the squared values and multiplied it by 6. After that I had to divide the number by the amount of values there were altogether and minus 1 from the answer and then multiple the answer by the amount of values there are again. Lastly I had to minus 1 by the divided. The formula is written as follows:
The answer is a value a number between -1 and 1. -1 would mean extremely strong negative correlation and 1 means extremely strong positive correlation and 0 would mean absolutely no correlation. An example of how I worked out my spearman rank is shown below
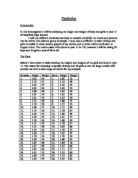
Stratified sample Girls Height and Weight
I separated the data into boys and girls to compare the results, from the graph you can see that the girls have positive correlation which is shown clearly by the line of best fit; from the graph we can also see that the girls have quite consistent height and height. The Spearman’s rank correlation for the girls is 0.36 which means it’s not very strong correlation but there is a definite weak positive correlation in the data.
Stratified sample Boys Height and Weight
From the boys graph you can see that the height is much less consistent than the girls there is a lot more variation in height compared to the girls and the data is more spread out. The scatter graph shows positive correlation and the line of best fit shows this clearly, the line of best fit is much steeper than the line of best fit in the girls scatter graph, Spearman’s rank correlation for the boy’s height and weight is 0.53 which means that there is fairly strong positive correlation and also that the correlation between height and weight in the boys is stronger than the girls.
Research from the Internet
I have included published results in my coursework to backup my hypothesis in proving it true and also help compare my results to published results to see how accurate my work is and how they differentiate.
The data in the graphs that are shown below comes from a cross sectional study that was performed during September to October 2005, on 606 Afghani pupils aged 6-14 years within Shahriar County of Tehran, province of Iran. The sample size included 312 (56.1%) boys and 284 (46.9%) girls who were originally recruited in order to determine their nutritional status.
Below is a graph which shows relation between height and weight of 606 Afghani pupils aged 6-14 years.
In this graph it clearly shows that there is a strong positive correlation. A clear line of best fit which runs through the data shows this clearly, the Spearman’s rank correlation is 0.8 which indicates that there is a positive strong relationship between these two variables. This implies that by increasing the heights of the pupils their weights are also increased to a large extent. The dots which have numbers next to them are some of the outliers.
Since other variables such as gender may confound the relationship between height and weight, two separate scatter plots were produced for boys and girls.
Below is a graph which shows relation between height and weight of 312 boys Afghani pupils aged 6-14 years
This diagram highlights that there is a positive strong relationship between these two variables in boys. The line of best fit is a clear positive increase. The Spearman’s rank correlation of the height and weight of the boys is 0.81 which means that there is really strong correlation.
Below is a graph which shows relation between height and weight of 284 girls Afghani pupils aged 6-14 years
This diagram highlights that there is a positive strong relationship between these two variables in girls. The line of best fit is a clear positive increase. The Spearman’s rank correlation of the height and weight of the girls is 0.79 which means that there is really strong correlation.
The boys scatter graph is overall more closer to the line of best fit than the scatter graph for the girls. The boys also have a higher Spearman’s rank correlation (0.81) compared to the girls (0.79) which shows that the correlation is stronger for the boys.
Source: http://www.me-jaa.com/mejaa21Mar2009/scatterplot.htm
Comparison between my stratified sample and research from the internet
My stratified sample which had the two genders combined height and weight showed positive correlation and so did the graph which was taken from the internet but the graph from the internet has a much higher Spearman's Rank Correlation as my graph had a Spearman’s Rank of 0.47 the graph from the internet had a Spearman’s rank of 0.8, the same with the boys height and weight graph and the girls height and weight graph, there are many factors to take into consideration like the fact that my sample only consisted of 60 students whereas the internet’s sample consisted of 606 students which would make their results more accurate, also the fact that students are overall more overweight in the UK compared to Afghanistan as very few students weight were over 55 kg in the sample from Afghanistan whereas the sample of the UK the heavier students were around 70 kg this can also be a reason why the sample from the internet has a stronger positive correlation, also the ages vary from 6 to 14 years in the sample from the internet whereas my sample has ages from 11 to 16 years, this can also be a reason why the internet sample is more closely correlated as less people may have reached the age of puberty and grown taller drastically, also the sample from the internet did not have equal proportions of boys and girls whereas my sample did, all of these reasons can be significant factors which can be the reason for the difference in the results.
Box Plots
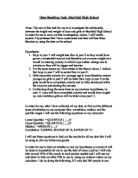
I decided to do box plots to show the range and distribution of the height and weight separately between boys and girls. I used the data from my stratified sample to create the box plots below.
Weight Distribution between boys and girls
The Box plots show that the overall boy’s weight distribution is more spread out than the girl’s weight distribution. From the box plot we can see that the boys range is 49 kg whereas the girl’s weight range is 43 kg which means that the girls is more consistent. The lower quartile is 45 kg and the upper quartile is 63.25 kg which gives the inter quartile range of 18.25 kg for the boys whereas for the girls the lower quartile is 42 kg and the upper quartile is 54.25 which gives the inter quartile range of 12.25 kg, this means that the girls weight is more consistent than the boys. The median for the weight of boys is 58.5 kg and for the girls it is 49 kg, this shows that boys are over all heavier than the girls and this is reinforced by the fact that the mean is 55.33 kg for the boys and 48.8 kg for the girls. There are no outliers for both boys and girls in this set of data. The standard deviation is 10.86 kg for the boys and 9.10 kg for the girls although there’s not that much difference between the two it still shows that the girl’s data is more consistent towards the mean compared to the boys. The overall boy’s weight box plot has strong positive skew, whereas the girl’s weight distribution is weak positive skew if not nearly symmetrical distribution.
Height Distribution between boys and girls
The Box plots show that the overall boy’s height distribution is more spread out than the girl’s height distribution. From the box plot we can see that the boys range is 0.49 m whereas the girl’s height range is 0.37 m which means that the girls is more consistent. The lower quartile is 1.56 m and the upper quartile is 1.7 m which gives the inter quartile range of 0.14 m for the boys whereas for the girls the lower quartile is 1.56 m and the upper quartile is 1.71 m which gives the inter quartile range of 0.15 m, this means that the boys height is very slightly more consistent than the girls. The median for the height of boys is 1.65 m and for the girls it is 1.62 m, this shows that boys are over all taller than the girls and this is reinforced by the fact that the mean is 1.64 m for the boys and 1.61 m for the girls. There are no outliers for both boys and girls in this set of data. The standard deviation is 0.102 m for the boys and 0.10 m for the girls although there’s hardly any difference between the two it still shows that the girl’s data is slightly more consistent towards the mean compared to the boys. Overall the boys have more of a positive skew while the girl’s box and whisker plot has negative skew. I find these results overall very surprising as I would have expected the boy’s height inter quartile range to be a lot more spread out and the standard deviation to be higher compared to the girls.
Conclusion
Overall I believe that I have proved my hypothesis ‘The taller you are the heavier you weigh’ true as all of the research I have done has shown that there is a definite positive correlation between the height and weight of students. All my graphs show that there is correlation including the research that was done from the internet show strong positive correlation. I found from both my stratified sample and the results from the internet that boys were overall more strongly correlated in height and weight compared to girls, I find these results very surprising as I had predicted the boys to have a weaker correlation than the girls due to the growth spurt they go through due to puberty but apparently I did not find this in my results this can be due to the simple fact that I may need to do more research and include a larger number of pupils in my sample. Although boys may be closely correlated the results were more spread out compared to the girls and they had a much larger range compared to the girls. Overall I am satisfied with my results and think I have successfully proved that the taller you are the heavier you weigh.