In contrast, it is not only girls who grow, but also boy’s go through a similar process, when they start their puberty. Therefore in many ways they grow as a person and as an individual. We can identify the changes; by the way they talk, and start to grow hair, on their body.
From this I can say that to some extent boys might weigh more than girls. But without great evidence and, me carrying out this investigation I wont know for sure if this is true.
The way in which I will carry out my investigation is by randomly selecting data’s from each gender and year groups. However the way in which I will select my data will be by using a graphic calculator and choosing numbers randomly by pressing the random function button, for example if I wanted to generate number of girls in year 7 of 141, I will put the information into the calculator and press enter 50 times because my sample size is 50. But the one thing I need to be sure of is that I separate all the year 7 girls and boys and all the year 11 boys and girls to one side. This I because to ensure that I have an equal amount of boys and girls from each of the year group.
Calculator Button to give me the random numbers:
Example
150 girls in year 7:
RAN INT (150)
The reason for me deciding to use random sampling as one of sampling method is because to ensure my investigation not to be biased. I will do this by selecting a sample size of 50, which I will split equally to compare boys and girls. I believe that random sampling is the best way because in selecting information. I also chose random sampling as it is a representative sample from the population and gives a general view of the investigation.
When doing the investigation I will always keep an eye out for any problems that may occur in my data. Therefore I may come across a rouge data which are mistakes in the data, therefore in order for me to have a valid piece of data, I am going to try and avoid it. The way in which I will try to avoid this, will be simply if I do get one I will choose a different number and will replace it with another reliable random number.
However I may come across outlier data, therefore in order for me to over come this I may need to replace the data or even keep it, if it relevant. Furthermore when selecting my numbers randomly I may come across repetitive data which has occurred more then once, so this will also mean that I need to replace it by using a different number.
After collecting my random data’s I am going to transform the data in a cumulative frequency table. The reason for this is because it will give me a running total, therefore it will allow me to solve variety problems, such as it will allow me to work out, how many people lie in which intervals. But I have identified that if I use a cumulative frequency, that it does carry error’s when using grouped data. But I believe that a cumulative frequency is the appropriate method to use and my sample is large enough to.
However I will then use the information that I got from my cumulative frequency, such as the median, lower quartile, upper quartile, which will then make it easy for me to work out the inter quartile range. I will use these information and transfer it into a box plot as it will be easy for me to visualise and will make it easy to compare two set’s of data’s, for example boys and girls in this case.
Pilot Study:
I am now going to do a pre- test of my research. The reason for this is because I want to be able to get an average idea and see whether my prediction is correct. I am going to be creating my pilot study on year 7 girls and year 7 boys. This is linked with my first prediction that I made. As a result I will assume that my second hypothesis is correct for the time being. But I will later find out if this was the case, by completing the box plot result
Pre- Test for Female in year 7
Pre- Test for Males in year 7
Comparing the two pilot study result:
From looking at each of two graphs result, I have identified many things in which I believe give’s me an understanding that my prediction may be correct. One of the reasons for thinking such things is because by looking at the male and female’s results I have noticed, how girls weigh less than boys.
Furthermore from looking at the result I have also identified how although the girls and the boys are in the same year, how majority of the people, weigh the same and different to some extent. Therefore I believe that some of the males in year 7 may have started their puberty to give such results, same goes for the female in year 7.
However I cant help wondering how this is just the pilot study of my investigation, and all the result may change when I come to do my final research, for the two years and gender I am comparing it with.
Year 11 female:
Year 11 male:
Carrying out the research:
From going through my planning of this investigation, I am now going to carry out my research and taking it further in which to find out a solution for my hypothesis.
As you can see from my random sampling I have highlighted those which are my random numbers. I first started to select my random numbers for year 7 girls. Going through each of my random numbers, I have found some rouge data. Like I said earlier, when I find a rouge piece of data I will be replacing it with another random number. This is what I have done exactly by replacing the rouge data with another random number in this case. The reason for me replacing the two rouge data for example 140 kg and 110 kg, is because from my own knowledge and background research, I felt that it is less likely for a year 7 girl to weigh such. Therefore I replaced it with another figure, which is a better representative for the year 7 female.
I checked to see if I had picked up on further rouge data, but fortunately I wasn’t able to find others, when searching through the rest of my random sample numbers for boy’s and girls.
As I was going through each of my random numbers for boys and girls, I couldn’t stop worrying why I had found some rouge data just for year 7 girls. Therefore I carried out further research which helped me in understanding how the data might of has been misplaced or even miss read.
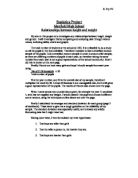
After conducting all my research I then decided to gather the entire of my random number’s and put it all onto a cumulative frequency table. This will later determine me of the number of people who each weigh the same or even weigh in between the range of numbers. Therefore this will give me an overall total of my cumulative frequency. The way in which I put together this table is by looking to see my lowest weight and finding out who weighed the most. I then split my numbers into categories and putted all my number going up in fives, for example 33 < x ≤ 35.
I used this method through out my research for boys and girls in collecting the numbers and putting it into a frequency table. The results are shown below:
Result 1)
From using the above result I am now going to create a cumulative frequency table.
Total 50
I have now used this results to create a cumulative frequency graph and found out the median, lower quartile, upper quartile and the inter quartile range.
The graph is shown below: (1)
RESULT OF GRAPH:
From looking at the graph I have recognised the median, lower quartile, upper quartile and inter-quartile range. From this result I am going to use the information to create my box plots. From looking at the graph I have identified a curve which states to me that my cumulative frequency table if fairly accurate. Using the rest of my result I have found out the same information which will also help me to create my box plot.
Result of the cumulative frequency table, which I have recognised.
How I got my results:
The way in which I got the results is by looking at my sample size, which was 50 and then finding 50% of it. So 50% of 50 is 25, so by looking at my cumulative and plotting my results, I went to the 25 and followed the line up until it reached the actual cumulative curve. I did this throughout the results, of each of my graph. However in order for me to find out the lower quartile I had to find out 25% of 50 which was 12.5, and the upper quartile was 75% which was 37.5. I used this result through out my result of graphs as my cumulative frequency table had the sample size of 50.
Result 2)
From using the above result I am now going to create a cumulative frequency table
Total 50
Graph is shown below: (2)
Result of the cumulative frequency table, which I have recognised.
Result 3)
From using the above result I am now going to create a cumulative frequency table
Graph is shown below:
Result of the cumulative frequency table, which I have recognised.
Result 4)
From using the above result I am now going to create a cumulative frequency table
Total 50
Box plot result:
Using this result I will be making my box plot, as it will be much clearer to understand and easy to visualise. Also I will be able to make comparison’s together using the result and checking to see whether my prediction was correct. Using this information I will also be able to judge my pilot study and see whether my pre-tests were correct. Therefore in order to see a result, the box plot will determine whether my prediction, were suitable for this investigation.
Analysis:
Throughout carrying this investigation my main purpose, was to see whether if the prediction I made earlier is correct, after gathering the result. As a result to this in order to check and see whether my hypothesis was correct, I carried out series of research and investigation. This included me looking at a high school called Mayfield, and collecting data’s randomly according to the weight of year 7 male and female as well year 11 male and female.
Furthermore from this information I collected, I made sure that I gathered the result and presented it in an appropriate way, so that the result is easy to compare with, as well as easy to understand. This is why I believe that it is useful that by presenting the result in a form of a cumulative frequency graph, and using information from the graph transforming it into a box plot was very efficient and useful when carrying out research like this.
In contrast to this, from carrying out this research, I was amazed at the result in which I had received, as to some extent my hypothesis did match with the statement I made, but however to some extent my result disputes my prediction to a certain degree.
The result in which I had obtained from carrying out this investigation, was that according to the result by comparing all the result, year 7 female’s range was smaller than the male in year 7, which shows how majority of the 50% of females lie in the interval of 42-50. This suggests how their result was fairly consistent as similarly each of the weight was in a small range.
Furthermore comparing both year 7 male and female, I have identified that for the median of the girls that although the median was much more, but both of the result was similarly the same. This goes to show how between the median and the weight of the students was fairly similar, in order of years. However looking at the interquartile range, that most of the girls are really close to the median, as they don’t vary as much whereas the boy’s median, is fairly spread out, and also majority of the boy’s weight is higher than the median. While on the other hand, the girl’s weight result is not spread out as much, as it fairly consistent, and within a small range. However the girls median deflect their overall their true weight.
Overall the boys and girls in year 7, overall weight doesn’t differ that much, but however to some extent the boys slightly are bigger than the girls and tend to way I bit more higher.
Moreover, looking at the result of the year 11 female and male, I was really amazed at the result in which I gained, as this slightly questioned me, in thinking how the both of the year 11 male and female’s weight doesn’t vary as much, and isn’t at all different to a level of circumstance. This immediately allows me to think how the female’s in year 11, median is smaller than the boys, this is completely the opposite to the result in which I received for year 7.Also the ineterquatile range, for the boys is just bigger than the girls, although the entire range for the girls is much more than the boys. This suggests how for some of the girls, at the far end, maybe they had one girl weighing big, were as the other’s kind of average. Therefore overall comparing both of the two year groups, the result are different but only just vaguely. Similarly both of the male and female weigh the same, and also they both outweigh year 7.
Overall throughout this investigation, comparing both of the two year groups, I am able to say that the results in which I have obtained are all very similar to one another. As by looking at year 7, both the male and female result was similar to one another as well as the year 11. This goes to show how, majority of the population in the school weighed all fairly the same, although there will be those who don’t fit in with the range, and are known as rouge data and outlier. Therefore I must consider how there will be those who tend to way of my range scale, which is why I may have got some rouge data’s.
Evaluation:
Throughout carrying out the research, in wanting to check whether my hypothesis was correct. As a result to this, I believe that to some extent I would agree in saying that my prediction was correct as, my prediction matches with the result in which I obtained for year 7. However looking at the result in which gained in year 11, I have to say that it differs quite a bit.
Furthermore, looking back at the way in which I carried out my investigation, there will certain are of the research in which if I could go back and change it I will complete certain tasks differently. This may include me collecting my sample random number’s differently, as I believe that this was a weak part of my findings. The reason for saying this I because, I believe that my sample may have been incorrect, maybe in the way the data’s where collected, or by the method used to collect the data’s.
However despite, the weakness, there where many strength within this project, this included how it was easy to compare the two year groups, as the result in which I gained was to the point. Also when receiving rouge data’s I was able to avoid it really well, by replacing it with another one. This made my results reliable, as less rouge data’s existed.
Conclusion:
Overall, I believe the project was successful although I would have had liked to see a much better range within the result, to suit my hypostasis. This is because; if my investigation was very accurate and fairly placed, as I hoped then I believe the result would have some difference to the one I received currently.
Moreover, I believe that to some extent my prediction does match with the result but also on the other hand, it may vary.