I also think that the more hours of TV watched per week, the lesser the likelihood of achieving their full potential i.e. getting good SATS results. On comparison with boys and girls I predict that there won’t be a significant difference, and if there is, then I will enquire it further and look at possible reasons why. Further predictions will be made as I progress through my project.
Investigation
The first thing I did is decide on the kind of Data I need, how much I need and how I am going to sample it.
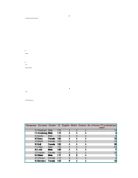
As I am doing a line of enquiry that is targeting children of a certain abilities group, my sampling will not be random. It will have to be stratified. Once I filtered out the data I need (children with an IQ over 95), I chose a random sample of 50 using the Random Command button on my scientific calculator. For the time being, I chose randomly out of two year groups, Year ten and eleven, as I am not comparing them just yet. Here is my sample:
I am now going to start looking at my first enquiry; does a high IQ automatically mean good SATS results. To do this I will work out a mean average of the individuals SATS results, and compare them to the average SATS result of my stratified sample.
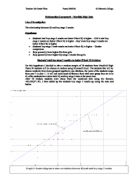
To do this comparison, I have produced a Scatter Diagram. I chose a Scatter diagram because it is the best way to show whether there is a relationship between two pieces of data. If there is, my Scatter diagram will display it as positive correlation, which it did in this case. From the scatter diagram you can clearly see that as the average SATS results increase, the IQ increases too. Therefore I now have something that seems to prove my prediction correct; the higher the IQ, the higher the SATS results.
So a high IQ should mean that you get good SATS results. It should, but it’s not certain. Let’s assume you have an IQ of 98, but have got SATS results that make an exception to the pattern. What could be the cause of this? What factors affect this? One of those factors almost certainly is lifestyle. In the next section I will be investigating the average number of hours TV watched per week, and comparing it to the Average SATS result.
(DO CUMULATIVE FREQUENCY GRAPHS IF POSSIBLE FOR THIS)
(MAYBE HISTOGRAM WOULD BE BETTER, ASK MISS!)
At this point I would like to mention that my source of Data is completely reliable. It’s taken from Mayfield High School, and I have checked and made sure that there are no extreme, unrealistic results. If this was the case, it would have been noticed by now anyway, in the form of anonymous results; results which make exception to the pattern.
Now that I have compared and analysed SATS results with number of hours of TV watched, I am going to start looking at whether gender matters. I will be trying to find out if girls work more to their full potential than boys. To do this, I am going to random sample 50 high achieving girls and boys. To avoid bias, I will do a direct comparison before I start the actual investigation. It is necessary to do this because one gender might be naturally higher-achieving than the other in this high-school, so all further enquires would be based on bias data.