Maths Coursework
Hypothesis 1
On average, year nine students that watch more television per week have a higher IQ.

Group the data
Mean: 1600/100 = 16 hours.
Mean: 9760/100 = 97.6, round up to whole number – 98.
TV :: Stem & Leaf
LQ – 25th number (highlighted)10 hours
UQ – 75th number (highlighted) 35 hours
IQR – 25 hours
Median – 18.5 hours
Mode - 14
IQ :: Stem & Leaf
LQ – 99
UQ – 107
IQR – 8
Median – 4
Mode - 100
IQ ...
This is a preview of the whole essay
Group the data
Mean: 1600/100 = 16 hours.
Mean: 9760/100 = 97.6, round up to whole number – 98.
TV :: Stem & Leaf
LQ – 25th number (highlighted)10 hours
UQ – 75th number (highlighted) 35 hours
IQR – 25 hours
Median – 18.5 hours
Mode - 14
IQ :: Stem & Leaf
LQ – 99
UQ – 107
IQR – 8
Median – 4
Mode - 100
IQ Statistics
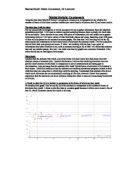
Hours of television watched statistics
My charts show that;
- Most of the students watch less than average hours of tv per week.
- Most students have a higher than average IQ.
For my first hypothesis I decided to do ‘On average, year nine students that watch more television per week have a higher IQ.’
I gathered my information from 50 boys and 50 girls that I randomly picked as I thought this would be more fair. I grouped the data and found the frequency and cumulative frequency from my results. I then did graphs to show the results and the median, IQ, LQ and IQR. I worked out the Mode and Range from the tables too.
I drew stem and leaf diagrams and arranged the data into numerical order.
I then Added up all the hours that the students watched all together and divided by one hundred to get the result. This result which was 16 hours was the average time that year nine spent watching television. Any number below that was grouped into ‘Low’ and any number that greater than that number was grouped as ‘High’.
I then Added up all the IQs that belonged to the students and divided by hundred to get the average IQ which is 98. This was the average IQ that a year nine student achieved. Any number below that was grouped into ‘Low’ and any number that greater than that number was grouped as ‘High’.
In tables, I wrote down the Hours people watched, Frequency, Cumulative Frequency, Class Widths, Mid point and the FX, which is the midpoint multiplied by the frequency. I added all the FX’s up which gave me the ΣFX and divided it by how many students data I had, (100) and this gave me an accurate average.
My conclusion is that according to my data and graphs there is no relationship or correlation.