Maths Coursework: Handling Data
Hypothesis
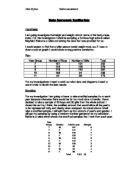
I am going investigate the height and weight ratio in terms of the body mass index. For this investigation I shall be sampling a fictitious high school called Mayfield. Below is a table containing the data that was provided for us:
Year Group
Number of Boys
Number of Girls
Total
7
51
31
282
8
45
25
270
9
18
43
261
0
06
94
200
1
84
86
70
I would expect to find that a taller person would weigh more, so, if I was to draw a scatter graph it would show strong positive correlation.
Plan
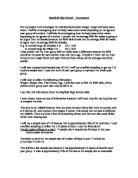
For my investigations I need to work out what data and diagrams I need to use in order to obtain the best results
Sampling
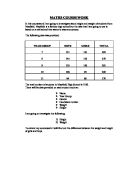
For my investigation I am going to have to take stratified samples from each year because otherwise there would be far too much data to handle. I have decided to take a sample of 30 boys and 30 girls from the whole school. I chose this as it is, I think, the smallest amount that would allow all the year's to be represented fairly and clearly when analysed. As stated above I shall take a stratified sample, I will split them up into strata's of year's and gender. I will get my samples by using a random number generator on my calculator. Below is a table which shows the stratified samples that I took from each year.
Year Group
Gender
Total in year
Sample
7
M
51
8
7
F
31
7
8
M
45
7
8
F
25
7
9
M
18
6
9
F
43
7
0
M
06
5
0
F
94
5
1
M
84
4
1
F
86
4
Total
183
30
Investigation
In my investigation I will be looking out for any differences in height and weight relationships between the boys and the girls, for example it is known the girls mature earlier than boys and I would be interested to see if my results show this.
Below is the data that I shall be using in my investigation:
Hypothesis
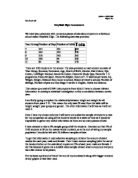
I am going investigate the height and weight ratio in terms of the body mass index. For this investigation I shall be sampling a fictitious high school called Mayfield. Below is a table containing the data that was provided for us:
Year Group
Number of Boys
Number of Girls
Total
7
51
31
282
8
45
25
270
9
18
43
261
0
06
94
200
1
84
86
70
I would expect to find that a taller person would weigh more, so, if I was to draw a scatter graph it would show strong positive correlation.
Plan
For my investigations I need to work out what data and diagrams I need to use in order to obtain the best results
Sampling
For my investigation I am going to have to take stratified samples from each year because otherwise there would be far too much data to handle. I have decided to take a sample of 30 boys and 30 girls from the whole school. I chose this as it is, I think, the smallest amount that would allow all the year's to be represented fairly and clearly when analysed. As stated above I shall take a stratified sample, I will split them up into strata's of year's and gender. I will get my samples by using a random number generator on my calculator. Below is a table which shows the stratified samples that I took from each year.
Year Group
Gender
Total in year
Sample
7
M
51
8
7
F
31
7
8
M
45
7
8
F
25
7
9
M
18
6
9
F
43
7
0
M
06
5
0
F
94
5
1
M
84
4
1
F
86
4
Total
183
30
Investigation
In my investigation I will be looking out for any differences in height and weight relationships between the boys and the girls, for example it is known the girls mature earlier than boys and I would be interested to see if my results show this.
Below is the data that I shall be using in my investigation: