Hypothesis A
I will plot on a scatter gram all the IQs and no. of hours of TV watched a week of each person in my sample. As this hypothesis is not age specific, both year 7 and 11 will be included. Once my scatter gram is drawn I will do a number of things to see if there is a strong correlation between IQ and no. of hours of TV watched a week.
Analysis
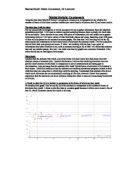
There are four outliers on the scatter gram that I have drawn. I have included these points because even though 2 people have very low IQs another 2 people watch a lot of TV they could be true and those values have not distorted the mean.
I found the mean point by adding up all of the number of hours of TV watched a week and divided it by the number of students in my sample (60).
Total no. of hours of TV watched a week = 1192 = 19.86666667 = 19.87 (2dp)
- 60
I then added up the total IQs and divided it by 60 to find the mean.
Total IQs = 5881 = 98.01666667 = 98.02 (2dp)
- 60
These 2 values then formed the co-ordinates of my mean point which I then plotted on the graph.
There was no line of best fit on my scatter gram as the points did not go in a particular direction or pattern. This also shows that there is no correlation.
All the points are scattered in all 4 quadrants. (4 lines were drawn from the mean point outwards making quadrants. Each of these quadrants was labelled to help to see if there was any correlation. This also shows no correlation.
As there is no correlation this does not support my hypothesis. This is because the hypothesis stated that there was a strong correlation between the no. of hours of TV watched a day and the IQ, but from the scatter gram it shows that there is no relationship between those 2 variables.
Hypothesis B
My second hypothesis is ‘year 11 girls have a higher IQ than year 7 girls’. To try and prove this right or wrong, I am going to draw 2 box plots on the same axis-1 for year 7 girls and one for year 11 girls. I will then compare them and see if my hypothesis is right.
Analysis
I drew the box plots by finding the smallest and largest values, the median and the upper and lower quartiles.
To find the median I used the formula:
Median = ½ (n+1)
= ½ (15+1)
= ½ 16
= 8th value
Year 7 = 101 Year 11 = 103
To find the lower quartile I used the formula:
LQ = ¼ (n+1)
= ¼ 16
= 4th value
Year 7 = 99 Year 11 = 97
To find the upper quartile I used the formula:
UQ = ¾ (n+1)
= ¾ 16
= 12th value
Year 7 = 108 Year 11 = 104
(See sheet with sample on for smallest and largest values etc.)
There is an outlier on the box plot for year 11 girls because the whisker is very long and is a lot bigger than 1.5 x length of the box.
Interquartile range= 7 Outlier = 11
x 1.5 = 10.5
92-10.5 = 81.5 11<81.5 therefore is an outlier.
As this is an outlier I have marked it with a cross (as it has been included when drawing the box) and drawn the whisker to the next point that is not an outlier.
I have done the same thing with the outlier value on the year 7 box plot.
Interquartile range = 9 Outliers = 132, 124
x 1.5 = 13.5
108+13.5 = 121.5 132>121.5 therefore they are outliers
124>121.5
There is no right hand whisker on the year 7 box plot because now the upper quartile and the largest value are the same.
The interquartile range for year 7 is greater than the box for year 11. This does not support my hypothesis that year 11 girls have a higher IQ than year 7 girls.
The lowest value and the highest value are both for year 7 girls, which shows that their results are more varied.
The median IQ for year 7 girls is 101, which is smaller than the median for year 11 girls, which is 103. Therefore on average year 11 girls have a higher IQ than year 7 girls thus supporting my hypothesis.
The lower quartile for year 7 girls is 99 which is bigger than the lower quartile for year 11 girls which is 97. Therefore the lower quartile does not support my hypothesis. The upper quartile for year 11 is 104 and for year 7 is 108. This supports the lower quartile and suggests that year 7 girls have a higher IQ than year 11 girls, thus not supporting my hypothesis.
Overall my hypothesis is not fully supported. The median values supported the hypothesis that girls in year 11 have a higher IQ than girls in year 7, but the lower and upper quartiles showed the opposite.
Hypothesis C
My third hypothesis is ‘year 7 boys watch more TV in a week than year 11 boys’. To try and prove this right or wrong, I am going to draw 2 box plots on the same axis-1 for year 7 boys and one for year 11 boys. I will then compare them and see if my hypothesis is right.
Analysis
I drew the box plots by finding the smallest and largest values, the median and the upper and lower quartiles.
To find the median I used the formula:
Median = ½ (n+1)
= ½ (15+1)
= ½ 16
= 8th value
Year 7 = 14 Year 11 = 18
To find the lower quartile I used the formula:
LQ = ¼ (n+1)
= ¼ 16
= 4th value
Year 7 = 10 Year 11 = 14
To find the upper quartile I used the formula:
UQ = ¾ (n+1)
= ¾ 16
= 12th value
Year 7 = 20 Year 11 = 21
(See sheet with sample on for smallest and largest values etc.)
The year 7 box plot has an outlier because the largest value is bigger than 1.5 x the interquartile range.
Interquartile range= 10 Outlier = 69
x 1.5 = 15.5
20+15.5 = 35.5 69> 35.5 therefore is an outlier.
Therefore I have put a cross where this point is (as it has been included when drawing the box) and drawn the whisker to the next value that is not an outlier.
I have done the same thing for the outlier in the year 11 box plot.
Interquartile range= 7 Outlier = 40
x 1.5 = 10.5
21+10.5 = 31.5 40> 31.5 therefore is an outlier.
The interquartile range for boys in year 7 is bigger than the interquartile range for year 11 boys. This supports the idea that boys in year 7 watch more TV than boys in year 11.
The lowest value is for both year 7 and 11 boys as they are the same. The highest value is for year 7 showing that their results are more varied. As the lowest values are the same but the highest value is for year 7 boys it shows that they watch more TV than boys in year 11.
The median no. of hours of TV watched a week for year 11 boys is higher than the median for year 7 boys. Therefore on average more year 11 boys spend longer watching TV than year 7 boys. This does not support my hypothesis.
The upper quartile of year 11 boys is bigger than that of year 7 boys. This shows that year 11 boys watch more TV than year 7 boys in a week thus not supporting my hypothesis.
The upper quartile of the year 11 box plot is the same as the largest value on the year 7 box plot, which shows that year 11 boys spend longer watching TV than year 7 boys, and again not supporting my hypothesis.
Overall my hypothesis is not fully supported. The interquartile ranges support the idea that year 7 boys watch more TV than year 11 boys as stated in my hypothesis but the medians and quartiles showed the opposite.
CONCLUSION
The first hypothesis was proved wrong as there was no correlation. This is probably because I needed a bigger sample e.g. 50 in each year, or the people in my sample had no connection between their IQs and no. of hours of TV watched a week but other people may do. With more people I can do further analysis and have a bigger range of points to help me see if there is any correlation.
The second hypothesis was also proved wrong. Only the median values supported it. The lower quartiles and upper quartiles did not because maybe the people in my sample were just not as clever as others who were not in my sample or I needed a bigger sample, e.g. 50 in each year, which would have given me a more accurate analysis.
The third hypothesis was also proved wrong- only the interquartile range supported it. The others probably did not because the median is not an accurate way of showing whether year 11 boys or year 7 boys watch more TV. If the mean was found it would be more accurate because it gives an average figure.
I will find the mean of each year and see if it supports my hypothesis.
Mean no. of hours of TV watched in a week by boys in year 7= 264 = 17.6hrs
15
Mean no. of hours of TV watched in a week by boys in year 11= 273 = 18.2hrs
15
This shows that year 11 boys watch more TV than boys in year 7 which still does not support my hypothesis.
I could also try with a bigger sample e.g. 50 in each year to make my analysis more accurate.