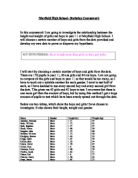
Number the girls in year 10 from 1 – 94
Number the boys in year 11 from 1 – 84
Number the girls in year 11 from 1 – 86
I will do this because this is the amount of pupils in that category as can be found in the candidate sheet.
- I realize that I need for a sample of 36, 6 boys and 6 girls from each year group. So I will find a random number on my calculator and then multiply this by the number of boys/girls in year 9/10/11 to find 6 boys and 6 girls in each year group. If this is a decimal, which it is likely to be I will use the normal rounding method of if it is above .5 I will round up if not I will round down.
- I will then find this number on my database and record them in a simple table displaying year group, surname, forename1, gender, height and weight.
Pre Test
From this data I have, I will pick 2 boys and 2 girls randomly from my 6 so that I can perform a pre test to see if there is a possible correlation between the heights and weights for boys and for girls. These will be on separate scatter graphs and I will use a mean line of best fit to test if the points are close to the line.
When I have my scatter graph, I will investigate how close to the line each point is and then I will add up the distances from the line for above the line and then for below the line and compare the values. If these values are close to each other I know that I have a possible correlation and can continue my investigation.
Problems with the Data
There are however, limitations to this data. This is not my data. It is someone else’s hand typed data. This causes problems from the start. Someone may have incorrectly typed a field and therefore I will be left with anomalous data.
Secondly, people may have been incorrectly measured or weighed which could affect my results dramatically.
Solving this problem if I receive an anomalous field I will still include it in my data because not both of the height and weight fields will be anomalous.
I have minimized my bias by using my sample that I have chosen. I have seen as there are different amounts of pupils in different years, I have chosen the same amount of pupils from each year but randomly. I have also chosen the same amount of boys and the same amount of girls.
Recording data, calculation and display
I am going to use different graphs and techniques in my project to obtain certain outcomes, which can then be analyzed further to achieve conclusions about my topic.
Firstly after I have obtained my data, I will put this in a simple chart displaying year group, surname, forename1, gender, height and weight. This will not show much but will make it easier for me to refer to the data rather than having to keep checking a spreadsheet. It will also show the data in a manageable way.
Secondly, I will produce tables for boys and girls displaying the fields, height (cm), tally, frequency and frequency density. I will repeat this for weight so I will have four tables all together.
From this, I can then draw a histogram which will show me the distributions of height and weight for boys and girls. I can then compare these to see if they are similar and I can see how well spread the data is. If there is field with many values in I could perhaps split this down to investigate this further. I can then make relevant comments on the distributions of heights and weights between boys and girls.
Thirdly, I will produce a cumulative frequency curve. This will allow me to calculate the median and inter-quartile ranges and also the modal group. Another advantage of a cumulative frequency curve is that I can calculate the percentage of students who have height in a given range. This will allow me to sort the anomalous data further. This will allow me to make a statement showing the probability of picking a boy or girl between two given heights or weights, if you picked a boy or girl at random from the data.
The median, inter quartile ranges and range can be illustrated by a box and whisker plot. I will need to find the highest and lowest values to produce this but it is an effective way of displaying data. I can then make a comment about how the averages differ between boys and girls.
Finally, I will produce scatter graphs to extend my investigation. I will produce one for boys and one for girls. I can ask that if a person is 150 cm tall how much should the person weigh? I can find this in my graph after I have drawn a line of best fit, a curve of best fit and the mean line of best fit to test my results. I can then make comments on the correlations of this data and put them into general statements about the whole school.
In my evaluation, I can the summarize all these points in key statements and I can say how I could extend this investigation further in the future and perhaps follow different lines of enquiry. I can say how successful my investigation was and how did biases affect my results. I can see how these statements backed my hypothesis and I can interpret the data and compare and contrast the results.