I am now going to compare KS3 to KS4, both weight and height, to find out what the median, mean and the range is from the data that I have used. To do this I am going to use a stem and leaf diagram.
KS3 height
From this stem and leaf diagram I am able to work out the mean, median and range. (Rounded to 2d.p)
KS4 height
From this stem and leaf diagram I am able to work out the mean, median and range. (Rounded to 2d.p)
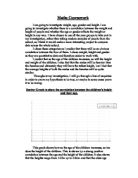
I can see on this graph that the mean, median and range are all higher for the sample of KS4 students than the sample of KS3 students. This therefore means that KS4 students will generally be taller than KS3 students.
Evidence from my sample suggests that 27 out of 30 or 89.9% of KS3 students have a height between 130 and 170 cm with only 20 out of 30 or 66.6% of KS4 having a height between 130 and 170 cm.
KS3 weight
From this stem and leaf diagram I am able to work out the mean, median and range. (Rounded to 2d.p)
KS4 weight
From this stem and leaf diagram I am able to work out the mean, median and range. (Rounded to 2d.p)
I can see in this graph that the mean, median and range are all higher for the sample of KS4 students than for the sample of KS3 students. This therefore means that KS4 students will generally be heavier than KS3 students.
Evidence from my sample suggests that 25 out of 30 or 83.3% of KS3 students have a weight between 30 and 60 kg compared to 20 out of 30 or 66.6% of KS4 students having a weight between 30 and 60 kg.
Preliminary Study Findings
From my preliminary study my main finding has been that from KS3 and KS4, you will be most likely to be heavier and taller in KS4. However, another purpose of my preliminary study was to find any anomalies. I found two anomalies from the data that I had randomly selected. One was in the KS4 weight and the other was KS4 height.
In my investigation of KS3, the smallest height was 1.36m and the largest height was 1.8m. Therefore, I am going to allow a 15% allowance either side of them to allow for smaller or larger heights if my random sample didn’t take the smallest genuine sizes. Therefore the boundaries for statistics allowed for KS3 height are 1.16 – 2.07m.
For KS3 weight, the lightest was 35kg and the heaviest was 62kg. Again I am going to allow a 15% allowance either side of that for my main study. Therefore the boundaries for statistics allowed for KS3 weight are 29.75 – 71.3kg.
In my investigation of KS4 I found 2 anomalies. In KS4 height, the smallest was 1.03m. However this was the statistic which I felt was an anomaly. Therefore the next smallest height was 1.53m and so I will take that as the smallest measurement. The highest measurement for KS4 height was 1.82m and so I have decided again to give a 15% allowance for my main study. Therefore the boundaries for statistics allowed for KS4 height are 1.3 – 2.09m.
For KS4 weight, my lightest statistic was 9kg but as this was an anomaly I have decided again to take the next statistic. The next statistic is 38kg. The heaviest for KS4 was 74Kg. Again I am going to allow 15% either side of this so that my main study will be as accurate as possible. Therefore the boundaries for statistics allowed for KS4 weight are 32.3 – 85.1kg.
Main Study
I think that the heavier a person is, the taller they are likely to be. Also I think that the taller a person is, the heavier they will be. However, I think that this will vary between the age of a person and their gender. I think this because from previous knowledge I know that different genders develop at different times and also that males have much larger BMI’s than females and that BMI’s are worked out from the weight and height of a person
For my main study I am going to be taking a new sample of 30 boys and 30 girls from KS3 and the same from KS4. The difference is that this time I will not be taking a random sample but I will be using stratified sampling. Stratified sampling will give me a much more representative set of data with me having KS’s with data then split into year groups and genders. I will have a much more representative set of data if I use stratified sampling than if I use random sampling. Through stratified sampling techniques I have worked out how many of each year group and gender I will need. For some of the sections, it was not definite which year I should take a student from because I needed a sample of 30 from each KS and sometimes there was either 1 person too many or one person short. Therefore, to work out which year group that extra persons data should be taken off or added to, I used a random number generator.
Here is the results table of my stratified sampling working out to tell me how many students I need from each group.
Another thing which I have done is that I have sorted the information on my database into year group order so that I can get the specific numbers which I will need to enter into the random number generator .I have then put the specific details into an online random number generator and these are the number which it has given me for each section. These are the numbers which tell me the data which I need to take from the spreadsheet.
Here are the statistics which the previous tables contents gave me. They are sorted into year group and gender.
I am now going to draw grouped frequency tables for the four sections so that I can access the data easier and it is in a much better arrangement.
To work out the averages for each of the groups I have showed data from in the above table, I am going to draw some charts to help me work out the means of the grouped data.
Now to work mean for each of the group I must divide the f x x by the total frequency.
Boys KS3 Weight
1510 = 50.3
30
Boys KS3 Height
4800 = 160
30
Boys KS4 Weight
1920 = 64
30
Boys KS4 Height
5300 = 176.7
30
Girls KS3 Weight
1420 = 47.3
30
Girls KS3 Height
4770 = 159
30
Girls KS4 Weight
1560 = 52
30
Girls KS4 Height
4980 = 166
30
From the means of the grouped data, I can see that for every group, the boys were larger than the girls. I can also see that between KS3 and KS4, the statistics for weight and height increased sufficiently more for the boys tan the girls every time. This shows that the boys are changing much more than the girls were between these two age groups.
I am going to draw a couple of scatter diagrams to compare weight and height for boys in KS3 and boys in KS4 and then girls in KS3 and KS4. I am going to use the data from the means of grouped data tables to plot a mean on each of the scatter diagrams to help me draw the line of best fit.
KS3 boys.
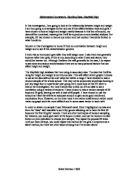
The scatter graph shows a positive correlation which tells me that as our variable gets higher, so does the other one. In this case, when the height gets larger, the weight gets larger and vise versa. However, the correlation isn’t very strong and so that tells me that in KS3 boys, as weight differs, their height doesn’t very much.
KS4 Boys
From this graph I can again see a positive correlation and so I can say that as height increases, so will weight and vise versa. The correlation is as last time not very strong and so we can once again say that at KS4 boys heights do not vary by much but their weights vary by quite a lot.
KS3 Girls
From this graph of KS3 girls, I can see a very strong positive correlation. This shows that as the girls are growing taller their heights are not changing by much.
KS4 Girls
From this graph of KS4 girls, I can see a fairly positive correlation. Howerver, unlike the scatter diagram of KS3 girls, this graph shows that the girls have more variation of their height than at KS3 but they still have that large variation in their weights.
KS3 boys compared to KS3 Girls
From this graph, I can see that at KS3, both males and females had a similar height and weight. The average heights are between 1.45 and 1.65 metres. The average weights are between 40 and 50 kg. However, I have also noticed that the majority of the rest of the girls are below the average weight and height whereas the rest of the boys are above the average height and weight. This suggests to me that boys are heavier and taller than girls.
KS4 boys compared to KS4 girls
From this graph, I can see that by KS4, girls and boys weights are rather different. Boys generally have a higher weight. The boys average weight is about 10 kg heavier than the girls and the height is about the same. I think that this is due to the fact that boys ‘fill out’ when they develop but girls don’t so that is why boys are heavier.
KS3 boys compared with KS4 girls
This graph shows the opposite ages from each gender. It shows the youngest boys weight and height and the eldest girl’s weight and heights. I thought that if I compared these two sets of statistics then I could see if I could show how different the genders are and their average weight and heights. This graph does indeed show how the youngest boys have a very similar height and weight to the eldest girls. The average weight is between 40 and 60kg and the average height is between 1.5 and 1.75 metres.
KS4 boys compared to KS3 girls.
This graph shows the opposite to the previous graph in that it shows the eldest boys and the youngest girls. From my findings that showed that boys had larger heights and weights compared to girls, I thought it would be a good idea to draw this graph because then I could see the full range of statistics from the smallest, youngest girls to the largest, oldest boys.
From this graph, I can see very clearly that these two sections of statistics give very different results. The graph shows that in KS3 and KS4, the smallest height is around 1.4 metres and the smallest weight is around 35kg. It also shows that the largest height is 2metres and the largest weight is around 95kg. This shows that in one school, the height can vary by roughly 60cm and the weight by roughly 60kg.
The following table gives the equations for the lines of best fit, for the group which it is next to. The equations show the relationship between height and weight and can be used to work out one piece of information if we only have the other one. For example, using the KS3 boys equation, with the information than a boy has a weight of 59kg, we can work out his height.
H=0.25W+1.4
57
H=0.25 x 59 +1.4
57
H= 0.258771929 +1.4
H= 1.65877193
I can use the other equations in the same way but for other groups of people.
In the table you can see that there is no equation for KS3 girls but instead it says problem. This is because when the computer plotted the data onto the graph, it did not start the graph at a height of 0cm but instead 145cm. Therefore, I was unable to find the crossing point of the line of best fit on the y axis to create the equation.
I am now going to draw some cumulative frequency graphs to allow me to make comparisons which should give very clear results. The cumulative frequency graphs will show me the region of each group which is the average area for most people in that group to be that weight and height. I can then compare them regions and see what they tell me. However, I need to draw up the cumulative frequency tables before I can draw the graphs. After the graphs is a table with the figures which I have acquired from the graph, on them. Also I am going to draw a box-and-whisker diagram to go with each so that the data is represented better.
I am now going to draw some cumulative frequency graphs with males, females and mixed populations on them so that I can compare genders but of the same age group.
Here are three box-and-whisker diagrams to show the data in the above.
Here are three box-and-whisker diagrams to show the data in the above.
Here are three box-and-whisker diagrams to show the data in the above.
Here are three box-and-whisker diagrams to show the data in the above.
Here is a table to compare the interquartile ranges of all of the cumulative lines which I have plotted onto the graphs above.
From this table I can see that when I look at boys and girls of the same age group, the girls have a much smaller interquartile range than the boys. This shows that the girls data is much more consistent than the boys and is therefore most likely represent the general weight and height of girls at that age. Also that the boys data is not going to be best representative of he boys of that age groups height and weight. For example if we look at the girls interquartile range for KS3 height, it is 9 compared with a staggering interquartile range of 15 for the boys KS3 height.
KS3 Boys Height
KS3 Boys Weight
KS3 Girls Height
KS3 Girls Weight
KS4 Boys Height.
KS4 Boys Weight.
KS4 Girls Height.
KS4 Girls Weight.
Now I am going to look at only the means of these statistics and see if there is anything interesting to find from them.
When I look at this results table showing the means for the heights and weights of boys and girls in certain age groups, I can see that every one of the age groups shows boys being bigger than girls. However, this is only the mean. There will be girls in each age group who are taller or heavier than the average for the boys of the same age group as their will be boys who are smaller than the average for the girls of the same age group. For example, if we look at KS3 boys and girls height. The mean for KS3 boys height was 158.9cm. If we look at this on the KS3 girls height cumulative frequency graph, we can see that approximately 12 girls had a height larger than that. Therefore, I can say that twelve thirtieths of KS3 girls have a height larger than the mean for KS3 boys.
Conclusion
I started off by carrying out a preliminary study. First of all I needed to get a selection of data from the spreadsheet provided. I decided to use random sampling so that I got a good range of data from the KS’s. The preliminary study gave me an idea of what the average height and weight is for each group I had chosen. That then gave me an idea of what I was dealing with. The preliminary study also allowed me to pick out any anomalies from my study and create boundaries for each group of the statistics which I would allow or not allow for my main study so that my results would be as accurate as possible.
After the preliminary study I moved onto my main study. For the main study I took a new sample of students from the database. However, this time I did not select the students for each KS at random. I decided to use a more representative technique which was stratified sampling. The stratified sampling allowed me to have a correct number of students in my sample for each year group in relation to how many there were in total. In my main study I used many different statistical techniques to find out different pieces of information which I could then compare. I used techniques such as cumulative frequency, mean of grouped data, mean vertical dispersion, histograms, scatter diagrams (their lines of best fit),frequency polygons, stem and leaf diagrams and box and whisper diagrams all to achieve the best comparisons.
In the main study, my main finding was that weight and height were related and that generally, as height increased so did weight and vise versa. However, I looked at whether this varied in the different genders and age groups. I found that it did indeed vary when these different factors are considered as you can see in my investigation. Another one of my major findings within this investigation was that boys data is far less consistent compared with the girls. I gained this from comparing the interquartile ranges for boys and girls of the same age group. For example if we look at the interquartile range of KS3 boys and girls heights, we find that the boys is 15 compared to a very low 9 for the girls. This just shows how consistent the girls data was compared to very inconsistent the boys was.
My findings have been fairly positive in this investigation but we must remember that this investigation was only carried out on a small number of students from one individual school. From my findings whilst comparing the interquartile ranges of boys to girls, I discovered just how inconsistent some of the data was and therefore I do feel like I would need to carry out a much larger sample of students if I needed to find a very reliable set of results. If I was to investigate further or test my findings then I would first need to take a larger age range, take a larger sample and take the students from different schools all over the country. The findings from different areas of the country due to a number of factors such as lifestyle and diets could be extremely varied and that is why I cannot at the moment really make a statement which is true for all boys and girls in the world but only for boys and girls at Mayfield High School where the sample was taken from.