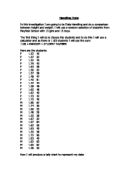
Pie chart
The Pie chart below represents the weight of the students.
The Pie chart below represents the height of the students.
Looking at the bar and pie chart from the previous page I have noted the following statements….
(1*38) + (1*39) + (1*40) + (1*41) + (1*43) + (1*44) + (2*45) + (1*47) + (2*48) + (2*49) + (1*50) + (2*51) + (1*52) + (1*53) + (1*54) + (1*56) + (2*57) + (1*59) + (³*60) + (1*62) + (1*64) + (1*66)
=
1 + 1 + 1 + 1 + 1 + 1 + 2 + 1 + 2 + 2 + 1 + 2 + 1 + 1 + 1 + 1 + 2 + 1 + 4 + 1 + 1 + 1
The mean weight of the students = 51.6 kg
(1*135) + (1*148) + (1*150) + (2*152) + (1*154) + (2*156) + (1*157) + (2*159)
+ (3*160) + (3*162) + (2*163) + (1*164) + (2*165) + (2*166) + (3*167) + (1*170) + (1*175) + (1*180)
=
1 + 1 + 1 + 2 + 1 + 2 + 1 +2 + 3 + 3 + 2 + 1 + 2 + 2 + 3 + 1 + 1 + 1
The mean height of the students = 160.7 cm
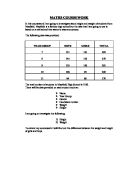
The modal weight of the students = 40 < w < 50cm = 11 students
The modal height of the students = 160 < h < 170cm = 16 students
The median weight of the student = 51 kg.
The median height of the student = 162 cm.
The range for the weight = 28 kg.
The range for the height = 45 cm.
Overall
These results show that there are only a few people from the sample who are tall than 170 cm and there is only one person who is shorter than 140 cm. More than 50% of the students in the sample are 160 < h < 170 cm tall. There are only two students who weigh between 30 < w < 40. 11 out of 30 students from the sample weigh between < 40 w < 50 and another ten students weigh between 50 < w < 60.
Extending the investigation
I am now going to look at the sample in more depth. I will extend my investigation upon the line of enquiry and give my self and hypothesis to test. This statement can either be true or false.
I will test the hypothesis by looking at a different data. I will extend my investigation by looking at the height and weight between boys and girls. I am going to start by testing the following hypothesis.
In general the taller the person height the heavier he is likely to be in weight.
New Sample
Inorder to investigate the difference between boys and girls I will be to taking a new sample using my previous method. I will take a sample of 15 boys and 15 girls in order to make it equivalent.
Second sample
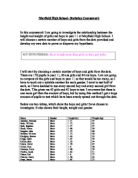
Tally chart shown below represents the heights of the students.
Table 1
Tally chart shown below represents the weights of the students.
Table 2
Table 3: Boys height
Table 4: Girls height
(1*136) + (1*147) + (1*150) + (2*152) + (1*154) + (1*159) + (2*161) + (1*163) + (2*165) + (2*171) + (1*177)
1 + 1 + 1 + 2 + 1 + 1 + 2 + 1 + 2 + 2 +1
The Mean height for Boys = 159cm
(1*142 + (2*148) + (1*150) + (1*152) + (1*153) + (1*157) + (1*160) + (1*164) + (1*165) + (1*172) + (1*173) + (2*175) + (1*180)
1 + 2 + 1 + 1 + 1 + 1 + 1 + 1 + 1 + 1 + 1 + 2 + 1
The Mean height for Girls = 161 cm
The Mode height for Boys = 160 < h < 170 cm = 5 boys
The Mode height for Girls = 150 < h < 160 cm = 4 Girls
The Median height for Boys = 161cm
The Median height for Girls = 160cm
The Range height for boys = 41cm
The Range height for girls = 38cm
Overall
As you can see all three measures of Mean, Median and Mode shows that Boys are either equal or greater in height than girls. In conclusion, although there are numbers of boys whose height is not taller than some girls, the evidence suggest that, in general, the height for boys is taller than the height for girls.
The only time when girl’s height were higher than boys height was when I found the average of mean for height. Other than all averages shows that boys are greater in height than girls.
Dual bar chart
Below is dual bar chart comparing the height between the boys and girls.
The modal height for boys in my sample was higher the modal height for the girls.
Table 5: Boys weight
Table 6: Girls weight
(1*35) + (1*42) + (1*45) + (1*47) + (1*48) + (1*50) + (2*52) + (1*53) +(1*57) + (2*60) + (1*64) + (1*68) + (1*72)
1 + 1 + 1 + 1 + 1 + 1 + 2 + 1 + 1 + 2 + 1 + 1 + 1
The Mean weight for boys is = 53 kg
(1*37) + (1*40) + (2*46) + (1*47) + (1*49) + (1*50) + (1*51) + (1*52) + (1*56) + (1*57) + (2*60) + (1*65) + (1*70)
1 + 1 + 2 + 1 + 1 + 1 + 1 + 1 + 1 + 1 + 2 + 1 + 1
The Mean weight for girls is = 52.4 kg
The Mode weight for Boys = 40 < w < 50, 50 < w < 60 = 5 Boys each
The Mode weight for Girls = 50 < w < 60 = 5 Girls each
The Median weight for Boys = 50 < w < 60
The Median weight for Girls = 50 < w < 60
The Range weight for boys = 37 kg
The Range weight for boys = 33 kg
Overall
As you can see all three measures of Mean, Median and Mode shows that Boys are either equal or greater in weight than girls. In conclusion, although there are numbers of boys whose weight is not heavier than some girls, the evidence suggest that, in general, the weight for boys is heaver than the height for girls.
Dual bar chart
Below is dual bar chart comparing the weight between the boys and girls.
The modal height for boys in my sample was equal the modal height for the girls. There was one girl and one boy who weighed between 30 < w < 40 and there was also one boy and girl who weighed between 70 < w < 80.
Histograms for Second Sample
Statements noted from the chart
The modal for Weight in the second sample is 50 < w < 60
Plus it shows there are only 2 people whose height is in between
70 < w < 80
The modal for Height in the second sample is 150 < h < 160
It also shows that there is only one person whose height is in between
130 < h < 140.
Stem and Leaf
As you can see on the stem & leaf table all three measures of average in the sample were higher for boys than for girls, although the only stoppage for perfection was the mean for girls in height were slightly higher than boys.
The evidence from the sample suggests that 10 out 15 boys have a height between
150 < h < 170, whilst 11 girls out of 15 have a height between 150 < h < 180.
Plus looking at the stem and leaf for the weight you can see that boys are greater than girls at all averages. With the range being 37 for boys and 33 for the girls.
Frequency Polygons For Boys & Girls
Height & Weight
Frequency polygons for the height shows that boys are greater than girls on the height between 150<h<170. Plus it shows there is less girls than boys below <150h.
Plus the frequency polygons for the weight show that boys are heavier than girls. Also it indicates the fact that boys have greater modal with 40<w<60 kg of weight.
Comparing Height and Weight
In order to extend my investigation I must try to follow this hypothesis…
In general the taller the person height the heavier he is likely to be in weight.
In order to test this hypothesis I used the sample that I chose at the beginning of this investigation.
Scatter Diagram of Height & Weight (First Sample)
Scatter diagram shows that there is positive correlation between height and weight. This means that the taller the person, the heavier they will be.
Further Investigation
In the early part of the investigation I found evidence to suggest that height and weight are both affected by gender. The next step taken is to extend the line of enquiry by showing the correlation between height and weight is affected by gender.
The hypothesis considered here is that there will be a better correlation between height and weight if we consider boys and girls separately.
The next three scatter graphs will show the plotting for girls, boys and one for whole sample.
The Evidence which supports the hypothesis
There will be a better correlation between height and weight if we consider boys and girls separately.
The line of best fit on the diagrams predict that a girl who is 1.50m tall would have a weight of 41 kg, where as a boy of the same height would weigh 42 kg.
Cumulative Frequency Graphs
As you can see on the Cumulative frequency graphs it shows the median, upper quartile, lower quartile and inter quartile range.
The results shows that the inter quartile range for girls are always higher than boys.
Summary Of Results
Here I will give you an analysis of my data. I will summarise some of the finding of this investigation, which shows what has been achieved by the investigation, and might produce ideas for further lines of enquiry. I will be referring back to all the graphs and comments when summarising the results…
- The stem and leaf diagram shows that modal for girls is always fewer than boys.
- There is a positive correlation between Height and Weight, which shows that the taller the person the more heavy they are.
- The points on the scatter diagram for both girls and boys are perfect upon each other on reading the correlation. This means both height are equally predictable
- The points on the scatter diagram for boys & girls are less dispersed than the points on the scatter graph for Mixed. This suggests that the correlation between height and weight is better when boys and girls are considered separately.
- Cumulative frequency curves confirm that boys are heavier than girls in weight.
- The median height for girl is higher than the medium height for boys.
One of the main limitations that I had within the investigation was that the average mean on height always was higher for girls than boys.
I might’ve been able to have a better result if I chose to research upon a larger quantity of students.
Doing this whole investigation I have found out that not all of the hypothesis can be true. Some of them can have its own downside, which means you can’t predict a perfect outline to the relationship. Though most of the results backs up my hypothesis by saying the taller you are the heavier you would likely to be.
Cumulative Frequency Graphs
Cumulative frequency can be a very powerful tool when comparing different data sets. This table shows the cumulative frequency for Height on boys, girls and mixed.
Cumulative Frequency Graphs