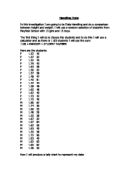
F 1.58 48
F 1.65 48
F 1.62 40
F 1.73 42
F 1.75 40
M 1.80 62
M 1.74 50
M 1.60 55
M 1.48 26
M 1.55 38
M 1.67 52
M 1.97 84
M 1.62 50
M 1.63 40
M 1.55 38
M 1.72 90
M 1.63 40
M 1.62 63
M 1.85 62
M 1.30 35
Now I will produce a tally chart to represent my data:
Height Tally Frequency
1.3 - 1.4 I 1
1.41 - 1.5 IIII 5
1.51 - 1.6 IIII III 8
1.61 - 1.7 IIII III 8
1.71 - 1.8 IIII I 6
1.81 - 1.9 I 1
1.91 - 2.0 I 1
There are very few people in the sample who are smaller than 1.41 metres and taller than 1.8 metres. Also by our sample it suggest that at Mayfield High School there are likely to be fewer people who are between 1.3>1.4 or 1.81>2.0 metres than other heights.
Now I will tally the weights of these pupils:
Weight Tally Total
26>30 I 1
31>40 IIII IIII 9
41>50 IIII IIII 10
51>60 IIII 4
61>70 III 3
71>80 0
81>90 III 3
As you will see by the tally the most frequent weight is the range between 41>50kg, I will show this in a graph to make it easier to see.
The modal weight is between 41 and 50 kg.
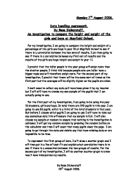
A hypothesis at the moment I would say would be the taller the person the heavier they will be this could be because of their bone structure usually the bigger the bones the heavier they will be.
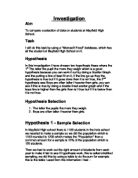
Now I will split the two groups of boys and girls up and tally each of them to see if my hypothesis is in any way true.
Female Height
Range 1.45m – 1.79m
- 3
- 3
- 3
- 3
- 0
- 1
- 1
Female Weight
Range 38kg-81kg
- 5
- 7
- 2
- 0
- 0
- 0
- 0
- 1
As you can see by these results my frequency chart is fairly ineffective because four of the ranges have zero and I should have increased the ranges.
Now I will put these in a graph to show how height and weight compare to each other for females.
My hypothesis seems to have worked for the females as the taller you are the heavier you are theory is true.
Now I will try this hypothesis on the Males:
Males Height
Range 1.30m– 1.97m
- 1
- 1
- 3
- 5
- 3
- 1
- 1
Males Weight
Range 26kg-84kg
- 1
- 5
- 2
- 2
- 3
- 0
- 2
Now I will put them into a table:
Now I have these graphs I see that there could be a change for the boys as the smaller you are the heavier you are.
Now I will compare the heights of both males and females in a graph:
This graph shows that males tend to be taller than females.
Now I will see who is the heavier of the two:
This also shows the males are heavier than females.
To conclude my investigation you can see by the results that the males seem to be heavier and taller than females.